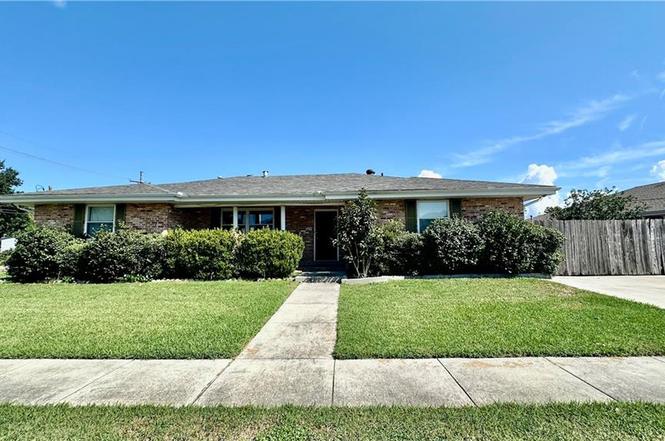
3244 Iowa Ave
Kenner, LA 70065
$299,000D+
4 bd · 3.0 ba ·
2,300 sqft ·
Built 1968
· SingleFamily
· Pending
· 89 DOM
Cashflow @ list (25.0% down · 7.5%)
Estimated rent
$2,493/mo
Mortgage (P&I)
−$1,568
Tax + insurance
−$329
HOA
−$0
Vac / Maint / Mgmt
−$524
Net cashflow
$73/mo
Annual
$872/yr
Cap rate
6.58%
Cash-on-cash
1.04%
DSCR
1.05
1% rule
0.83%
Cash to close
$83,720
Investor read
- This is a 4-bed/3.0-bath single-family listed at $299k.
- At list price, monthly cash flow is $73 ($872/yr) — positive.
- The deal already cash-flows at list — no discount required.
- To meet the 1% rule (rent ≥ 1% of price), the offer needs to be $249k (16.6% below list).
- It's been on market 89 days — a 6% lower offer ($281k) is reasonable based on typical stale-listing flexibility.
- Recommended offer: $249k (16.6% below list) — sets the bar for 1% rule.
- Local home prices are declining (-3.0%/yr); year-one equity from $2k of loan paydown is wiped out by about $9k of value loss. Plan a longer hold.
- Location reads 78/100 on livability (#6 in LA, #2,414 nationally) — a middle-class / working-renter tenant base. Strengths: cost of living A+, housing A+, health & safety A+; Watch: amenities C-, employment C-, crime D.
- Jefferson Parish (suburban): math 24% / reading 34% proficiency, ranked #44 of 98 in LA (top 45%) — low school quality limits family demand, transient renter base, plan for 1-2y turnover; 70% free/reduced lunch — lower-income household profile, screen leases tightly.
- Market conditions: Rents falling (-4.2%/yr); 293 active listings in the ZIP; 20 comparable units currently listed for rent nearby; rentals at typical pace (median 25d on market — plan ~3-4 weeks tenant-placement turnaround); 518 units permitted in Jefferson Parish in 2024 (43 in 5+ unit buildings).
- 8 sale attempts since 23y ago; this cycle's ask has dropped $20k (6%) from the opening price — seller is motivated, your offer sets the floor, not the list.
- Current owner paid $223k; 34% above their basis — modest negotiation headroom, anchor on the comps not their cost.
- Cap rate 6.6% vs local median 5.3% in Kenner — meaningfully above typical; check what's discounted (condition, days-on-market, listing class) to confirm the premium yield is real.
- This rent runs 44% of the median local income ($67k/yr) — at the standard rent-burdened threshold; future hikes will face affordability resistance.
Questions for listing agent
- It's been on market 89 days. Have you received any prior offers? Is the seller open to a 17% concession, seller financing, or rate buy-down credit?
- Built in 1968 — when were the roof, HVAC, electrical panel, plumbing, and water heater last replaced?
- Why hasn't it sold? Are there any deal-killer items the seller is aware of (foundation, flood, title, zoning, code violations)?
- Is there a deadline driving the sale (1031 exchange, divorce, estate, relocation)? That informs how much negotiation room exists.
- Crime grade is D in this area — have there been break-ins, vandalism, or insurance claims at this property in the last 3 years? What carrier currently insures it and at what premium?
- The area grade is low — what's the realistic commute time and amenity access for the typical tenant pool here? Any planned neighborhood developments (good or bad) we should know about?
- What's the average days-on-market for RENTAL listings here right now (not sales)? A rising rental-DOM trend means longer vacancies and softer asking-rent achievability than the comps imply.
- What's the recent tenant-quality profile in this submarket — average credit score on applications, eviction rate, late-payment / NSF rate, and stable-employment percentage? A property-management company in the area should have these aggregated.
CashFlowRE · CFR-KJD3S2429RV4K9
· Data 3 weeks ago
cashflowre.app · 2026-05-29