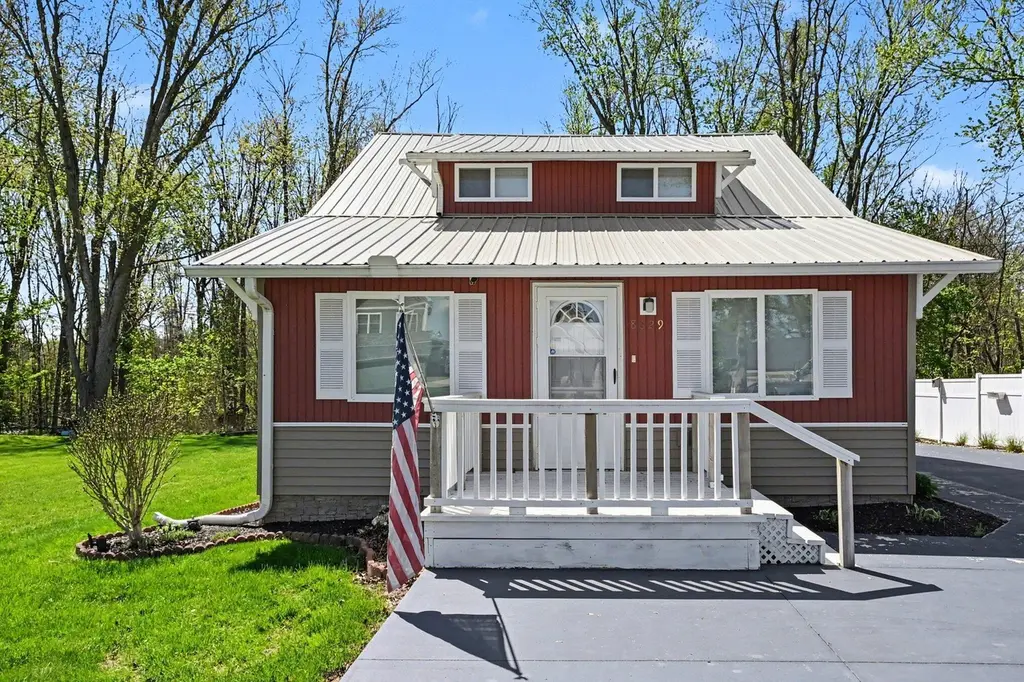
8629 E Hatchery Rd
Enchanted Hills, IN 46567
$1F
3 bd · 2.0 ba ·
1,824 sqft ·
Built 1953
· SingleFamily
· Pending
· 27 DOM
Cashflow @ list (25.0% down · 7.5%)
Estimated rent
$1,324/mo
Mortgage (P&I)
−$1,781
Tax + insurance
−$566
HOA
−$0
Vac / Maint / Mgmt
−$278
Net cashflow
$-1,300/mo
Annual
$-15,605/yr
Cap rate
1.70%
Cash-on-cash
-16.41%
DSCR
0.27
1% rule
0.39%
Cash to close
$95,080
Investor read
- This is a 3-bed/2.0-bath single-family listed at $1.
- At list price, monthly cash flow is $-1k ($-16k/yr) — negative.
- The deal already cash-flows at list — no discount required.
- Meets the 1% rule at list price ($1k rent vs $1).
- It's been on market 27 days — a 2% lower offer ($0) is reasonable based on typical stale-listing flexibility.
- Local home prices are declining (-3.0%/yr); year-one equity from $2k of loan paydown is wiped out by about $10k of value loss. Plan a longer hold.
- Location reads: area grade F — affects rentability + tenant quality, not the cash-flow math above.
- Wawasee Community School Corporation (town): math 32% / reading 39% proficiency, ranked #179 of 301 in IN (top 60%) — families likely to look elsewhere, expect single-tenant / working-renter base with shorter leases.
- Zoned schools: Syracuse Elementary School (math 49% / reading 38%, grade F, #411 of 994 statewide, top 42%, 533 students, 52% FRL); Wawasee Middle School (math 24% / reading 34%, grade F, #222 of 330 statewide, top 67%, 507 students, 50% FRL); Wawasee High School (math 27% / reading 56%, grade F, #211 of 369 statewide, top 58%, 909 students, 44% FRL).
- Watch-outs: property tax is 509358.3% of price; built in 1953 — expect roof / HVAC / electrical / plumbing capex.
- Market conditions: 87 active listings in the ZIP; 261 units permitted in Kosciusko County in 2024 (10 in 5+ unit buildings).
- Kosciusko County population projected at +3% by 2050 — modest demand growth; plan on rents tracking national, not racing it.
- 7 sale attempts since 9y ago with the ask held roughly flat each time — persistent listings suggest the price (not the market) is what's stuck; bring a comps-based counter.
- Cap rate 1.7% vs local median 0.3% in Enchanted Hills — top-decile yield for the area; either an underpriced asset or a hidden risk that comps aren't pricing in. Stress-test before assuming the spread holds.
Questions for listing agent
- What do current leases actually rent for vs. the listed asking? Can we see a recent rent roll and the last 12 months of T-12 income?
- Built in 1953 — when were the roof, HVAC, electrical panel, plumbing, and water heater last replaced?
- Property tax is high relative to price — has the assessment been appealed recently, and will the sale trigger a re-assessment?
- Is there a deadline driving the sale (1031 exchange, divorce, estate, relocation)? That informs how much negotiation room exists.
- The area grade is low — what's the realistic commute time and amenity access for the typical tenant pool here? Any planned neighborhood developments (good or bad) we should know about?
- What's the average days-on-market for RENTAL listings here right now (not sales)? A rising rental-DOM trend means longer vacancies and softer asking-rent achievability than the comps imply.
- What's the recent tenant-quality profile in this submarket — average credit score on applications, eviction rate, late-payment / NSF rate, and stable-employment percentage? A property-management company in the area should have these aggregated.
- How much new for-sale + rental construction is in the pipeline within 1–3 miles? Heavy new supply typically softens prices + rents 12–24 months out; constrained supply supports both.
CashFlowRE · CFR-KK2C504F8SC2H3
· Data 2 weeks ago
cashflowre.app · 2026-05-29