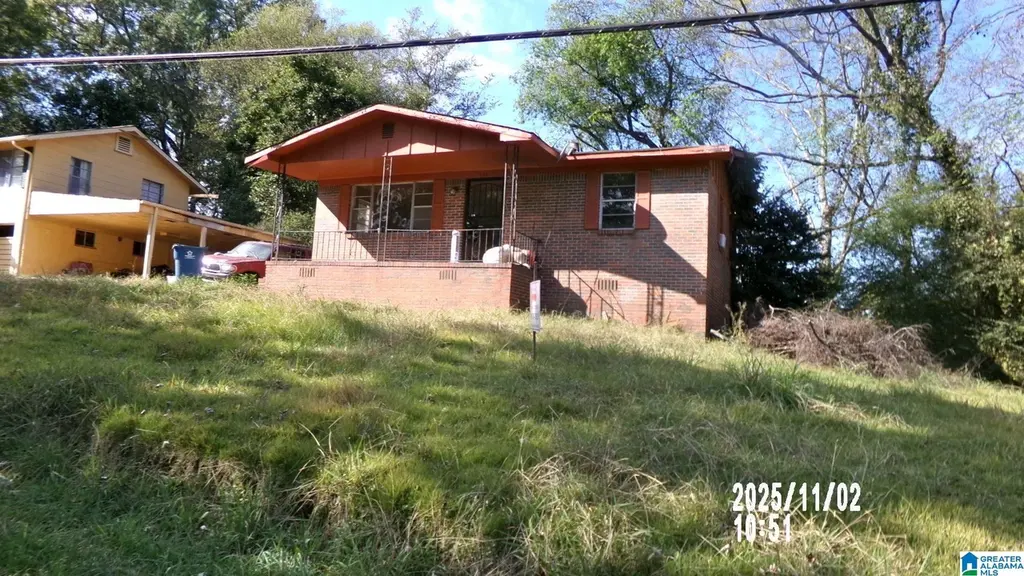
508 9th St
Midfield, AL 35228
$36,500B+
2 bd · 1.0 ba ·
825 sqft ·
Built 1963
· SingleFamily
· Active
· 17 DOM
Cashflow @ list (25.0% down · 7.5%)
Estimated rent
$1,035/mo
Mortgage (P&I)
−$191
Tax + insurance
−$54
HOA
−$0
Vac / Maint / Mgmt
−$217
Net cashflow
$572/mo
Annual
$6,866/yr
Cap rate
25.10%
Cash-on-cash
67.18%
DSCR
3.99
1% rule
2.84%
Cash to close
$10,220
Investor read
- This is a 2-bed/1.0-bath single-family listed at $36k.
- At list price, monthly cash flow is $572 ($7k/yr) — positive.
- The deal already cash-flows at list — no discount required.
- Meets the 1% rule at list price ($1k rent vs $36k).
- It's been on market 17 days — a 2% lower offer ($36k) is reasonable based on typical stale-listing flexibility.
- Recommended offer: $36k (1.5% below list) — sets the bar for market timing.
- Local home prices are declining (-3.0%/yr); year-one equity from $252 of loan paydown is wiped out by about $1k of value loss. Plan a longer hold.
- Location reads 64/100 on livability (#164 in AL) — a middle-class / working-renter tenant base. Strengths: commute A+, cost of living A+, housing A+; Watch: schools F, amenities F, employment F.
- Midfield City (suburban): math 2% / reading 14% proficiency, ranked #126 of 129 in AL (top 98%) — low school quality limits family demand, transient renter base, plan for 1-2y turnover; 83% free/reduced lunch — lower-income household profile, screen leases tightly.
- Market conditions: Rents soft (-1.5%/yr); 87 active listings in the ZIP; 18 comparable units currently listed for rent nearby; rentals leasing fast (median 11d on market — plan ~1-2 weeks tenant-placement turnaround); 2,114 units permitted in Jefferson County in 2024 (556 in 5+ unit buildings).
- Jefferson County population projected to shrink 4% by 2050 — rents likely to lag national; underwrite the cash flow, not the appreciation.
- At projected returns (-3.0% appreciation + 0.0% rent growth), your $10k cash investment doubles in ~2 years — after that, you're playing with house money.
- Climate carrying-cost: major wind risk, 27% chance of damaging wind over 30y; extreme-heat days projected 6→15/yr by 2055 (HVAC capex compounding) — expect insurance premiums to compound above CPI over the hold.
- Cap rate 25.1% vs local median 10.0% in Midfield — top-decile yield for the area; either an underpriced asset or a hidden risk that comps aren't pricing in. Stress-test before assuming the spread holds.
Questions for listing agent
- Built in 1963 — when were the roof, HVAC, electrical panel, plumbing, and water heater last replaced?
- Is there a deadline driving the sale (1031 exchange, divorce, estate, relocation)? That informs how much negotiation room exists.
- Schools are F-rated, which usually means shorter tenancies and higher turnover. Who's the typical renter profile here, and what's been the actual vacancy rate?
- What's the average days-on-market for RENTAL listings here right now (not sales)? A rising rental-DOM trend means longer vacancies and softer asking-rent achievability than the comps imply.
- What's the recent tenant-quality profile in this submarket — average credit score on applications, eviction rate, late-payment / NSF rate, and stable-employment percentage? A property-management company in the area should have these aggregated.
- How much new for-sale + rental construction is in the pipeline within 1–3 miles? Heavy new supply typically softens prices + rents 12–24 months out; constrained supply supports both.
CashFlowRE · CFR-KK7DMYBENT54N5
· Data 1 day ago
cashflowre.app · 2026-05-29