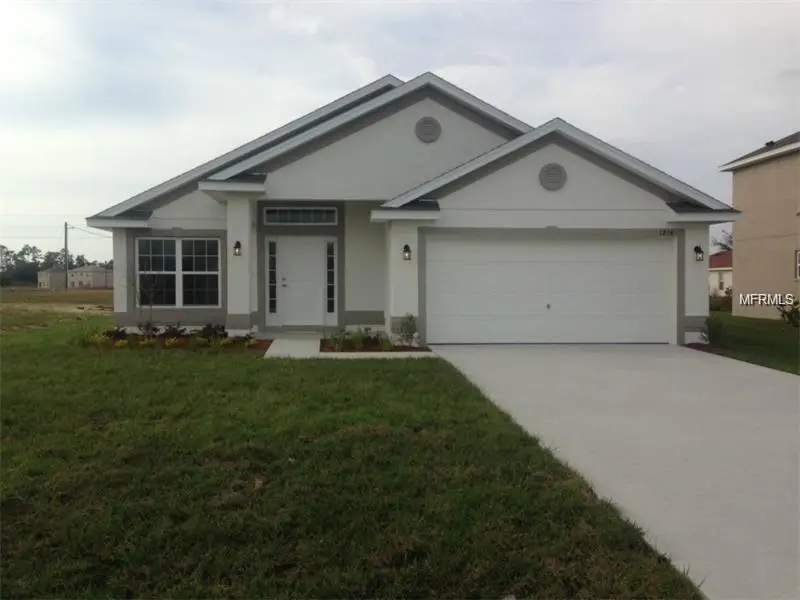
1173 Sabine Ln
Poinciana, FL 34759
$232,000D-
3 bd · 2.0 ba ·
1,437 sqft ·
Built 2017
· SingleFamily
· Active
· 1 DOM
Cashflow @ list (25.0% down · 7.5%)
Estimated rent
$1,941/mo
Mortgage (P&I)
−$1,217
Tax + insurance
−$387
HOA
−$100
Vac / Maint / Mgmt
−$408
Net cashflow
$-170/mo
Annual
$-2,044/yr
Cap rate
5.41%
Cash-on-cash
-3.15%
DSCR
0.86
1% rule
0.84%
Cash to close
$64,960
Investor read
- This is a 3-bed/2.0-bath single-family listed at $232k.
- At list price, monthly cash flow is $-170 ($-2k/yr) — negative.
- To cash-flow at today's rent, offer at most $207k (10.6% below list).
- To meet the 1% rule (rent ≥ 1% of price), the offer needs to be $194k (16.4% below list).
- Only 1 days on market — expect competitive offers; lowballing is unlikely to land.
- Recommended offer: $194k (16.4% below list) — sets the bar for 1% rule.
- Local home prices are declining (-1.5%/yr); year-one equity from $2k of loan paydown is wiped out by about $3k of value loss. Plan a longer hold.
- Location reads 57/100 on livability (#859 in FL) — a working-class tenant base; expect higher turnover. Strengths: cost of living A+, housing A+; Watch: employment D+, schools F, amenities F.
- Polk (suburban): math 39% / reading 43% proficiency, ranked #62 of 73 in FL (top 85%) — families likely to look elsewhere, expect single-tenant / working-renter base with shorter leases.
- Market conditions: Rents rising (+1.1%/yr); 1151 active listings in the ZIP; 21 comparable units currently listed for rent nearby; rentals at typical pace (median 20d on market — plan ~3-4 weeks tenant-placement turnaround); 10,384 units permitted in Polk County in 2024 (1,716 in 5+ unit buildings).
- Polk County population projected at +33% by 2050 — long-run rental-demand tailwind backs the buy-and-hold thesis.
- Cap rate 5.4% vs local median 4.3% in Poinciana — meaningfully above typical; check what's discounted (condition, days-on-market, listing class) to confirm the premium yield is real.
- This rent runs 34% of the median local income ($69k/yr) — at the standard rent-burdened threshold; future hikes will face affordability resistance.
Questions for listing agent
- What do current leases actually rent for vs. the listed asking? Can we see a recent rent roll and the last 12 months of T-12 income?
- What does the HOA fee cover, when was the last increase, and are there any pending special assessments or reserve-fund shortfalls?
- Is there a deadline driving the sale (1031 exchange, divorce, estate, relocation)? That informs how much negotiation room exists.
- Schools are F-rated, which usually means shorter tenancies and higher turnover. Who's the typical renter profile here, and what's been the actual vacancy rate?
- The area grade is low — what's the realistic commute time and amenity access for the typical tenant pool here? Any planned neighborhood developments (good or bad) we should know about?
- What's the average days-on-market for RENTAL listings here right now (not sales)? A rising rental-DOM trend means longer vacancies and softer asking-rent achievability than the comps imply.
- What's the recent tenant-quality profile in this submarket — average credit score on applications, eviction rate, late-payment / NSF rate, and stable-employment percentage? A property-management company in the area should have these aggregated.
- How much new for-sale + rental construction is in the pipeline within 1–3 miles? Heavy new supply typically softens prices + rents 12–24 months out; constrained supply supports both.
CashFlowRE · CFR-KMZ49D1D19M2CM
· Data 2 days ago
cashflowre.app · 2026-05-29