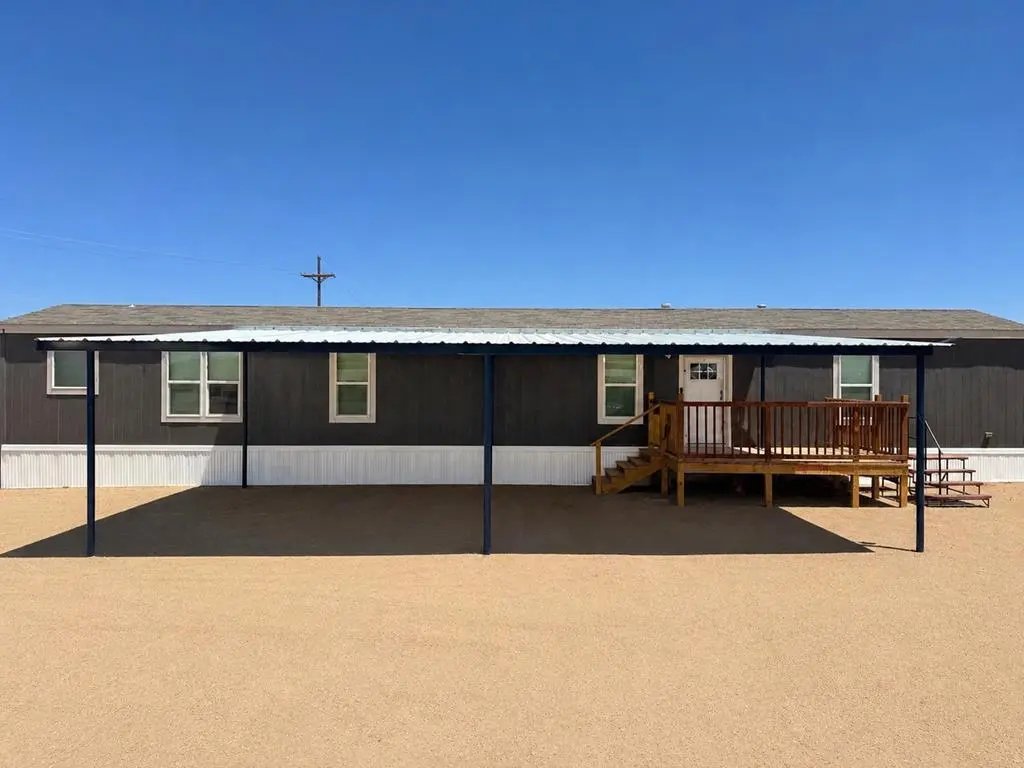
TBD N Laura Mae Ave
West Odessa, TX 79763
$260,000F
3 bd · 2.0 ba ·
1,216 sqft ·
Built 2024
· Land
· Active
· 55 DOM
Cashflow @ list (25.0% down · 7.5%)
Estimated rent
$1,842/mo
Mortgage (P&I)
−$1,363
Tax + insurance
−$433
HOA
−$0
Vac / Maint / Mgmt
−$387
Net cashflow
$-341/mo
Annual
$-4,096/yr
Cap rate
4.72%
Cash-on-cash
-5.63%
DSCR
0.75
1% rule
0.71%
Cash to close
$72,800
Investor read
- This is a 3-bed/2.0-bath land listed at $260k.
- At list price, monthly cash flow is $-341 ($-4k/yr) — negative.
- To cash-flow at today's rent, offer at most $211k (19.0% below list).
- To meet the 1% rule (rent ≥ 1% of price), the offer needs to be $184k (29.1% below list).
- It's been on market 55 days — a 3% lower offer ($252k) is reasonable based on typical stale-listing flexibility.
- Recommended offer: $184k (29.1% below list) — sets the bar for 1% rule.
- Local home prices are declining (-3.0%/yr); year-one equity from $2k of loan paydown is wiped out by about $8k of value loss. Plan a longer hold.
- Location reads 61/100 on livability (#1,026 in TX) — a middle-class / working-renter tenant base. Strengths: cost of living A+, housing A+; Watch: health & safety C-, crime F, amenities F.
- Ector County ISD (urban): math 22% / reading 27% proficiency, ranked #707 of 826 in TX (top 86%) — low school quality limits family demand, transient renter base, plan for 1-2y turnover.
- Zoned schools: Noel El (math 18% / reading 18%, grade F, #3,785 of 4,322 statewide, top 88%, 451 students, 85% FRL); Crockett Middle (math 21% / reading 19%, grade F, #1,428 of 1,662 statewide, top 87%, 1,036 students, 66% FRL); Odessa H S (math 18% / reading 22%, grade F, #1,397 of 1,632 statewide, top 87%, 3,874 students, 68% FRL) — zoned schools average 73% FRL vs 56% district-wide (17 pts higher); higher-poverty schools than district average — tighter screening recommended.
- Market conditions: 123 active listings in the ZIP; 1,004 units permitted in Ector County in 2024 (0 in 5+ unit buildings).
- Ector County population projected at +78% by 2050 — long-run rental-demand tailwind backs the buy-and-hold thesis.
- 26 sale attempts since 4y ago with the ask held roughly flat each time — persistent listings suggest the price (not the market) is what's stuck; bring a comps-based counter.
- Climate carrying-cost: major wildfire risk; extreme-heat days projected 7→22/yr by 2055 (HVAC capex compounding) — expect insurance premiums to compound above CPI over the hold.
- This rent runs 39% of the median local income ($57k/yr) — at the standard rent-burdened threshold; future hikes will face affordability resistance.
Questions for listing agent
- What do current leases actually rent for vs. the listed asking? Can we see a recent rent roll and the last 12 months of T-12 income?
- It's been on market 55 days. Have you received any prior offers? Is the seller open to a 29% concession, seller financing, or rate buy-down credit?
- Is there a deadline driving the sale (1031 exchange, divorce, estate, relocation)? That informs how much negotiation room exists.
- Schools are F-rated, which usually means shorter tenancies and higher turnover. Who's the typical renter profile here, and what's been the actual vacancy rate?
- Crime grade is F in this area — have there been break-ins, vandalism, or insurance claims at this property in the last 3 years? What carrier currently insures it and at what premium?
- The area grade is low — what's the realistic commute time and amenity access for the typical tenant pool here? Any planned neighborhood developments (good or bad) we should know about?
- What's the average days-on-market for RENTAL listings here right now (not sales)? A rising rental-DOM trend means longer vacancies and softer asking-rent achievability than the comps imply.
- What's the recent tenant-quality profile in this submarket — average credit score on applications, eviction rate, late-payment / NSF rate, and stable-employment percentage? A property-management company in the area should have these aggregated.
CashFlowRE · CFR-KNS1SF8ZXKQM6W
· Data 36 min ago
cashflowre.app · 2026-05-29