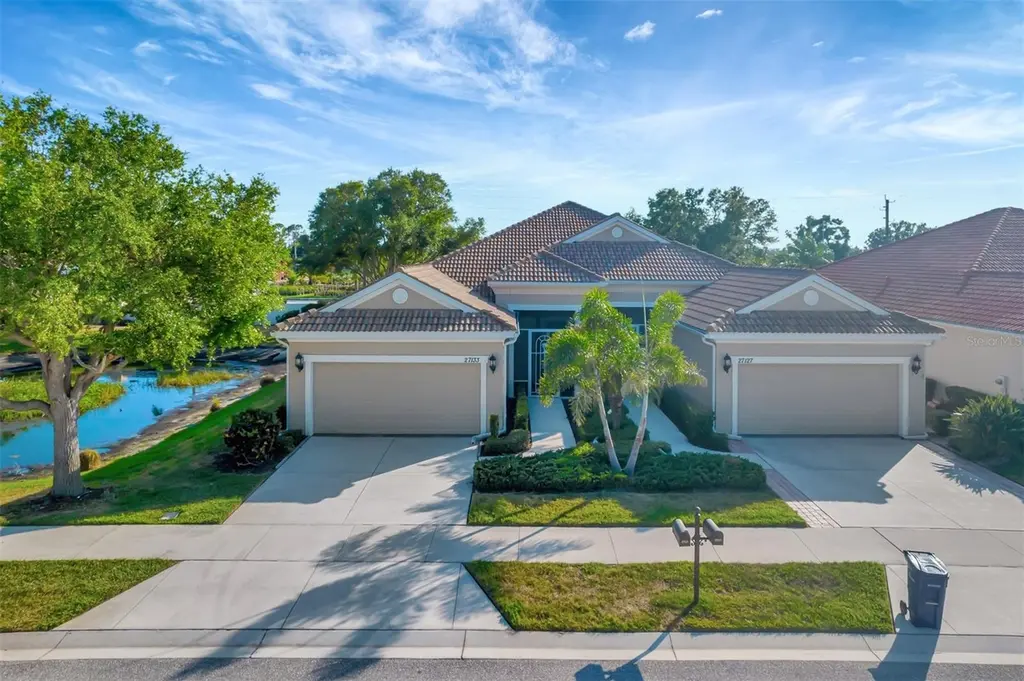
27133 Ipswich Dr
Englewood, FL 34223
$289,000D
2 bd · 2.0 ba ·
1,560 sqft ·
Built 2013
· SingleFamily
· Active
· 586 DOM
Cashflow @ list (25.0% down · 7.5%)
Estimated rent
$2,615/mo
Mortgage (P&I)
−$1,516
Tax + insurance
−$423
HOA
−$300
Vac / Maint / Mgmt
−$549
Net cashflow
$-173/mo
Annual
$-2,075/yr
Cap rate
5.58%
Cash-on-cash
-2.56%
DSCR
0.89
1% rule
0.90%
Cash to close
$80,920
Investor read
- This is a 2-bed/2.0-bath single-family listed at $289k.
- At list price, monthly cash flow is $-173 ($-2k/yr) — negative.
- To cash-flow at today's rent, offer at most $258k (10.6% below list).
- To meet the 1% rule (rent ≥ 1% of price), the offer needs to be $262k (9.5% below list).
- It's been on market 586 days — a 12% lower offer ($254k) is reasonable based on typical stale-listing flexibility.
- Recommended offer: $254k (12.0% below list) — sets the bar for market timing.
- Local home prices are declining (-3.0%/yr); year-one equity from $2k of loan paydown is wiped out by about $9k of value loss. Plan a longer hold.
- Location reads 73/100 on livability (#321 in FL) — a middle-class / working-renter tenant base. Strengths: housing A+, cost of living A, health & safety A; Watch: employment C-, amenities F, commute F.
- Sarasota (urban): math 63% / reading 63% proficiency, ranked #7 of 73 in FL (top 10%) — acceptable for families but not a draw, mixed tenant base, ~2y average lease.
- Zoned schools: Englewood Elementary School (math 65% / reading 66%, grade B+, #500 of 2,144 statewide, top 24%, 587 students, 52% FRL).
- Market conditions: Rents rising fast (+9.0%/yr); 726 active listings in the ZIP; solid renter incomes; 7,466 units permitted in Sarasota County in 2024 (2,138 in 5+ unit buildings).
- Sarasota County population projected at +20% by 2050 — long-run rental-demand tailwind backs the buy-and-hold thesis.
- 17 sale attempts since 17y ago; this cycle's ask is 14350% above the opening price — seller raised mid-cycle; expect resistance to lowballs.
- Climate carrying-cost: severe wind risk, 99% chance of damaging wind over 30y; extreme-heat days projected 7→31/yr by 2055 (HVAC capex compounding) — expect insurance premiums to compound above CPI over the hold.
- Cap rate 5.6% vs local median 3.8% in Englewood — top-decile yield for the area; either an underpriced asset or a hidden risk that comps aren't pricing in. Stress-test before assuming the spread holds.
- This rent runs 41% of the median local income ($76k/yr) — at the standard rent-burdened threshold; future hikes will face affordability resistance.
Questions for listing agent
- What do current leases actually rent for vs. the listed asking? Can we see a recent rent roll and the last 12 months of T-12 income?
- It's been on market 586 days. Have you received any prior offers? Is the seller open to a 12% concession, seller financing, or rate buy-down credit?
- What does the HOA fee cover, when was the last increase, and are there any pending special assessments or reserve-fund shortfalls?
- Why hasn't it sold? Are there any deal-killer items the seller is aware of (foundation, flood, title, zoning, code violations)?
- Is there a deadline driving the sale (1031 exchange, divorce, estate, relocation)? That informs how much negotiation room exists.
- Schools are A-rated — typically a magnet for longer-tenancy family renters. What's the average tenant stay here, and is there a school-zone premium baked into asking?
- The area grade is low — what's the realistic commute time and amenity access for the typical tenant pool here? Any planned neighborhood developments (good or bad) we should know about?
- What's the average days-on-market for RENTAL listings here right now (not sales)? A rising rental-DOM trend means longer vacancies and softer asking-rent achievability than the comps imply.
CashFlowRE · CFR-KPH6NJB4Q2GGHA
· Data 21 h ago
cashflowre.app · 2026-05-29