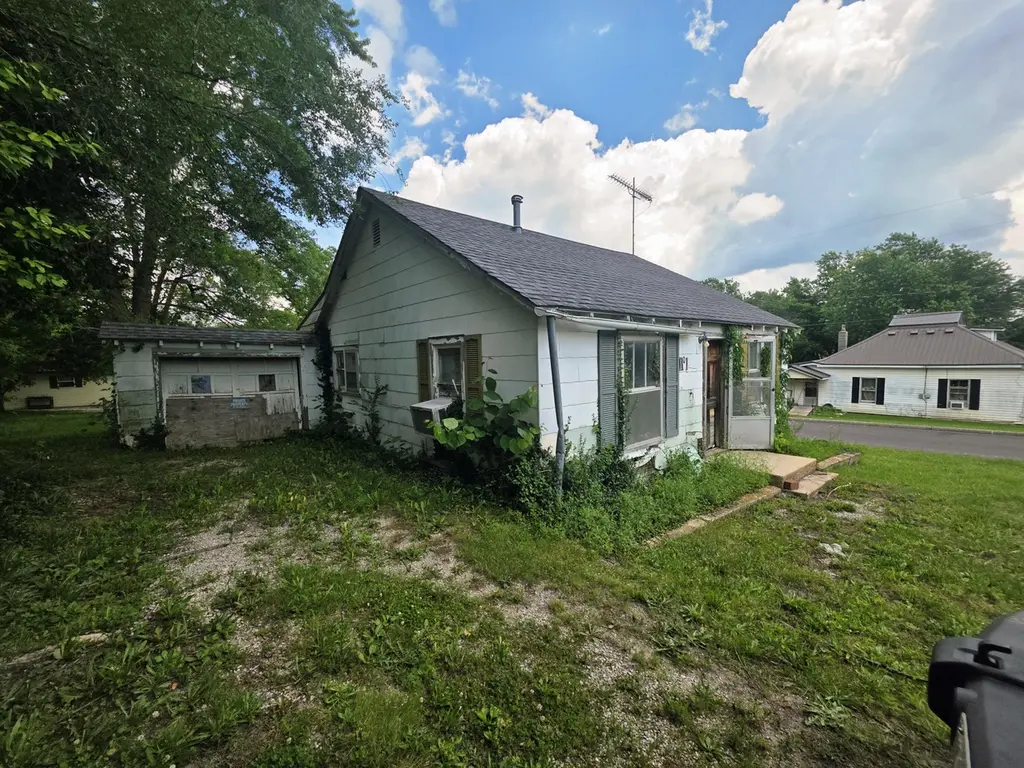
1101 N Oakland Ave
Mountain Grove, MO 65711
$24,000D
3 bd · 1.0 ba ·
912 sqft ·
Built 1940
· Other
· Pending
· 10 DOM
Cashflow @ list (25.0% down · 7.5%)
Estimated rent
$1,007/mo
Mortgage (P&I)
−$126
Tax + insurance
−$21
HOA
−$0
Vac / Maint / Mgmt
−$211
Net cashflow
$649/mo
Annual
$7,786/yr
Cap rate
38.74%
Cash-on-cash
115.87%
DSCR
6.16
1% rule
4.19%
Cash to close
$6,720
Investor read
- This is a 3-bed/1.0-bath other listed at $24k.
- At list price, monthly cash flow is $649 ($8k/yr) — positive.
- The deal already cash-flows at list — no discount required.
- Meets the 1% rule at list price ($1k rent vs $24k).
- Only 10 days on market — expect competitive offers; lowballing is unlikely to land.
- Local home prices are declining (-3.0%/yr); year-one equity from $166 of loan paydown is wiped out by about $720 of value loss. Plan a longer hold.
- Location reads 66/100 on livability (#251 in MO) — a middle-class / working-renter tenant base. Strengths: cost of living A+, housing A-, health & safety A-; Watch: amenities F, commute F, employment F.
- Mountain Grove R-III (town): math 48% / reading 49% proficiency, ranked #73 of 324 in MO (top 22%) — families likely to look elsewhere, expect single-tenant / working-renter base with shorter leases.
- Zoned schools: Mountain Grove Elem. (math 50% / reading 53%, grade C-, #268 of 1,115 statewide, top 24%, 688 students, 58% FRL); Mountain Grove Middle (math 47% / reading 48%, grade C-, #88 of 391 statewide, top 24%, 476 students, 60% FRL); Mountain Grove High (math 47% / reading 47%, grade D-, #155 of 521 statewide, top 32%, 444 students, 54% FRL) — zoned schools at 57% FRL track the district average.
- Watch-outs: built in 1940 — expect roof / HVAC / electrical / plumbing capex.
- Market conditions: 129 active listings in the ZIP; 23 units permitted in Wright County in 2024 (0 in 5+ unit buildings).
- Wright County population projected at -28% by 2050 — secular population decline; favor cash flow + early exit over multi-decade hold.
- At projected returns (-3.0% appreciation + 3.0% rent growth), your $7k cash investment doubles in ~1 year — after that, you're playing with house money.
- Cap rate 38.7% vs local median 2.8% in Mountain Grove — top-decile yield for the area; either an underpriced asset or a hidden risk that comps aren't pricing in. Stress-test before assuming the spread holds.
Questions for listing agent
- Built in 1940 — when were the roof, HVAC, electrical panel, plumbing, and water heater last replaced?
- Is there a deadline driving the sale (1031 exchange, divorce, estate, relocation)? That informs how much negotiation room exists.
- The area grade is low — what's the realistic commute time and amenity access for the typical tenant pool here? Any planned neighborhood developments (good or bad) we should know about?
- What's the average days-on-market for RENTAL listings here right now (not sales)? A rising rental-DOM trend means longer vacancies and softer asking-rent achievability than the comps imply.
- What's the recent tenant-quality profile in this submarket — average credit score on applications, eviction rate, late-payment / NSF rate, and stable-employment percentage? A property-management company in the area should have these aggregated.
- How much new for-sale + rental construction is in the pipeline within 1–3 miles? Heavy new supply typically softens prices + rents 12–24 months out; constrained supply supports both.
CashFlowRE · CFR-KQJFPH2TX0TYZ3
· Data 3 days ago
cashflowre.app · 2026-05-29