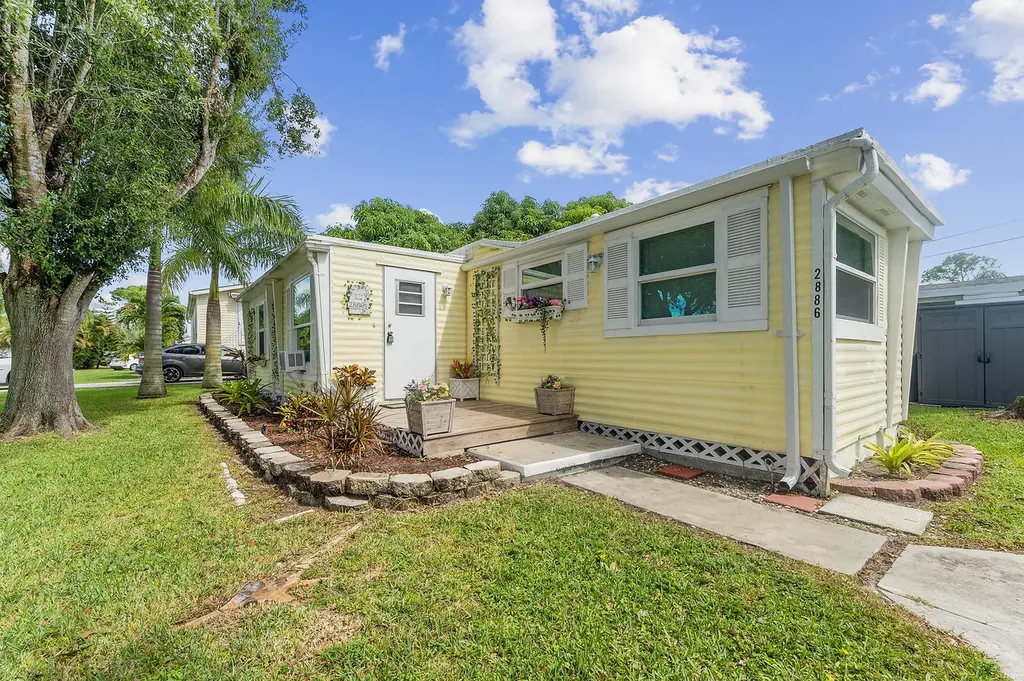
2886 SE La Palma Ter
Port Salerno, FL 34997
$189,000C+
2 bd · 1.0 ba ·
520 sqft ·
Built 1974
· Manufactured
· Active
· 25 DOM
Cashflow @ list (25.0% down · 7.5%)
Estimated rent
$2,101/mo
Mortgage (P&I)
−$991
Tax + insurance
−$235
HOA
−$0
Vac / Maint / Mgmt
−$441
Net cashflow
$433/mo
Annual
$5,201/yr
Cap rate
9.04%
Cash-on-cash
9.83%
DSCR
1.44
1% rule
1.11%
Cash to close
$52,920
Investor read
- This is a 2-bed/1.0-bath manufactured listed at $189k.
- At list price, monthly cash flow is $433 ($5k/yr) — positive.
- The deal already cash-flows at list — no discount required.
- Meets the 1% rule at list price ($2k rent vs $189k).
- It's been on market 25 days — a 2% lower offer ($186k) is reasonable based on typical stale-listing flexibility.
- Recommended offer: $186k (1.5% below list) — sets the bar for market timing.
- Local home prices are declining (-3.0%/yr); year-one equity from $1k of loan paydown is wiped out by about $6k of value loss. Plan a longer hold.
- Location reads 70/100 on livability (#440 in FL) — a middle-class / working-renter tenant base. Strengths: housing A+, crime A, health & safety A; Watch: schools D, amenities F, commute F.
- Martin (suburban): math 52% / reading 53% proficiency, ranked #24 of 73 in FL (top 33%) — acceptable for families but not a draw, mixed tenant base, ~2y average lease.
- Market conditions: Rents rising (+2.7%/yr); 588 active listings in the ZIP; 2 comparable units currently listed for rent nearby; solid renter incomes; 737 units permitted in Martin County in 2024 (167 in 5+ unit buildings).
- Martin County population projected at +19% by 2050 — long-run rental-demand tailwind backs the buy-and-hold thesis.
- 4 sale attempts since 22y ago; this cycle's ask has dropped $34k (15%) from the opening price — seller is motivated, your offer sets the floor, not the list.
- Current owner paid $126k; list at $189k implies a 50% gain — meaningful room to come down on a strong offer.
- Climate carrying-cost: severe wind risk, 99% chance of damaging wind over 30y; extreme-heat days projected 7→24/yr by 2055 (HVAC capex compounding) — expect insurance premiums to compound above CPI over the hold.
- Cap rate 9.0% vs local median 3.1% in Port Salerno — top-decile yield for the area; either an underpriced asset or a hidden risk that comps aren't pricing in. Stress-test before assuming the spread holds.
- This rent runs 32% of the median local income ($78k/yr) — at the standard rent-burdened threshold; future hikes will face affordability resistance.
Questions for listing agent
- Built in 1974 — when were the roof, HVAC, electrical panel, plumbing, and water heater last replaced?
- Is there a deadline driving the sale (1031 exchange, divorce, estate, relocation)? That informs how much negotiation room exists.
- Schools are D-rated, which usually means shorter tenancies and higher turnover. Who's the typical renter profile here, and what's been the actual vacancy rate?
- What's the average days-on-market for RENTAL listings here right now (not sales)? A rising rental-DOM trend means longer vacancies and softer asking-rent achievability than the comps imply.
- What's the recent tenant-quality profile in this submarket — average credit score on applications, eviction rate, late-payment / NSF rate, and stable-employment percentage? A property-management company in the area should have these aggregated.
- How much new for-sale + rental construction is in the pipeline within 1–3 miles? Heavy new supply typically softens prices + rents 12–24 months out; constrained supply supports both.
CashFlowRE · CFR-KRM3PP7JB8FAFH
· Data 6 days ago
cashflowre.app · 2026-05-29