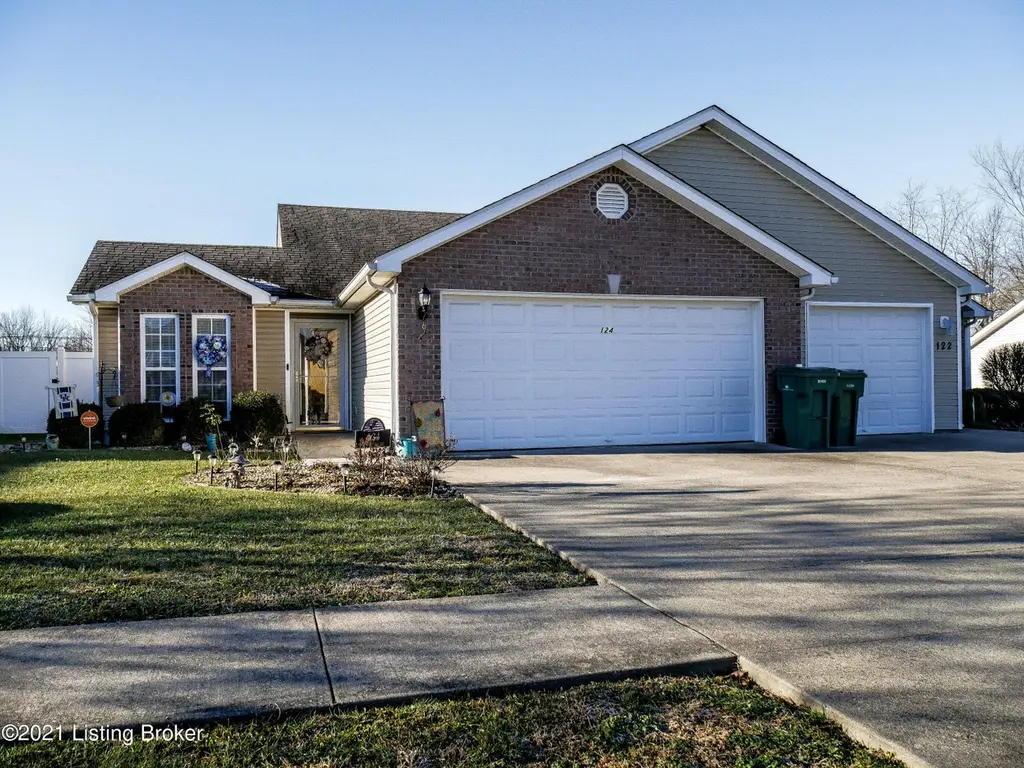
124 Applewood Ln
Radcliff, KY 42701
$242,500D
2 bd · 2.0 ba ·
1,199 sqft ·
Built 2007
· MultiFamily
· Active
· 48 DOM
Cashflow @ list (25.0% down · 7.5%)
Estimated rent
$2,237/mo
Mortgage (P&I)
−$1,272
Tax + insurance
−$248
HOA
−$0
Vac / Maint / Mgmt
−$470
Net cashflow
$247/mo
Annual
$2,969/yr
Cap rate
7.52%
Cash-on-cash
4.37%
DSCR
1.19
1% rule
0.92%
Cash to close
$67,900
Investor read
- This is a 2-bed/2.0-bath multifamily listed at $242k.
- At list price, monthly cash flow is $247 ($3k/yr) — positive.
- The deal already cash-flows at list — no discount required.
- To meet the 1% rule (rent ≥ 1% of price), the offer needs to be $224k (7.8% below list).
- It's been on market 48 days — a 3% lower offer ($235k) is reasonable based on typical stale-listing flexibility.
- Recommended offer: $224k (7.8% below list) — sets the bar for 1% rule.
- Local home prices are declining (-3.0%/yr); year-one equity from $2k of loan paydown is wiped out by about $7k of value loss. Plan a longer hold.
- Location reads 61/100 on livability (#367 in KY) — a middle-class / working-renter tenant base. Strengths: cost of living A+, housing A+, crime B; Watch: schools D-, amenities F, commute F.
- Hardin County (suburban): math 30% / reading 43% proficiency, ranked #47 of 165 in KY (top 28%) — families likely to look elsewhere, expect single-tenant / working-renter base with shorter leases.
- Market conditions: Rents rising (+3.3%/yr); 539 active listings in the ZIP; 1 comparable units currently listed for rent nearby; 946 units permitted in Hardin County in 2024 (464 in 5+ unit buildings).
- Hardin County population projected at -16% by 2050 — secular population decline; favor cash flow + early exit over multi-decade hold.
- 6 sale attempts since 8y ago with the ask held roughly flat each time — persistent listings suggest the price (not the market) is what's stuck; bring a comps-based counter.
- Current owner paid $174k; 39% above their basis — modest negotiation headroom, anchor on the comps not their cost.
- Climate carrying-cost: extreme-heat days projected 7→20/yr by 2055 (HVAC capex compounding) — expect insurance premiums to compound above CPI over the hold.
- Cap rate 7.5% vs local median 3.5% in Radcliff — top-decile yield for the area; either an underpriced asset or a hidden risk that comps aren't pricing in. Stress-test before assuming the spread holds.
- This rent runs 39% of the median local income ($70k/yr) — at the standard rent-burdened threshold; future hikes will face affordability resistance.
Questions for listing agent
- It's been on market 48 days. Have you received any prior offers? Is the seller open to a 8% concession, seller financing, or rate buy-down credit?
- Is there a deadline driving the sale (1031 exchange, divorce, estate, relocation)? That informs how much negotiation room exists.
- Schools are D-rated, which usually means shorter tenancies and higher turnover. Who's the typical renter profile here, and what's been the actual vacancy rate?
- The area grade is low — what's the realistic commute time and amenity access for the typical tenant pool here? Any planned neighborhood developments (good or bad) we should know about?
- What's the average days-on-market for RENTAL listings here right now (not sales)? A rising rental-DOM trend means longer vacancies and softer asking-rent achievability than the comps imply.
- What's the recent tenant-quality profile in this submarket — average credit score on applications, eviction rate, late-payment / NSF rate, and stable-employment percentage? A property-management company in the area should have these aggregated.
- How much new apartment / multifamily construction is in the pipeline within 1–3 miles? Heavy new supply (>2% of stock underway) typically softens rents 12–24 months out; light construction supports rent growth.
CashFlowRE · CFR-KT71AP0JMYACH9
· Data 3 weeks ago
cashflowre.app · 2026-05-29