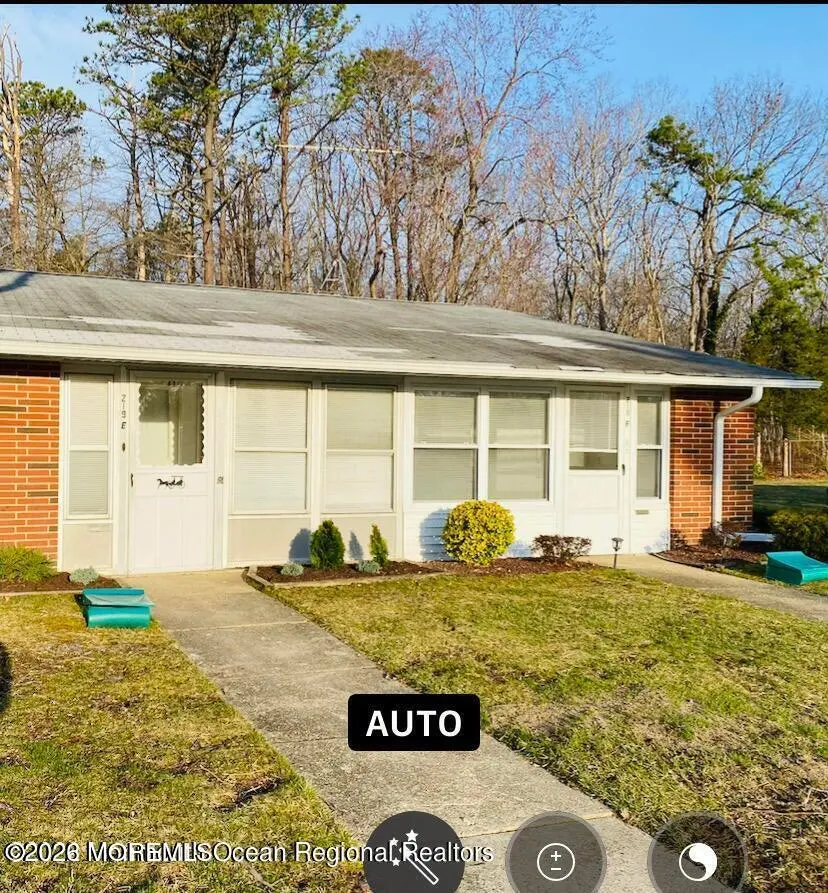
219 Buckingham Ct Unit E
Leisure Village, NJ 08701
$134,900C
1 bd · 1.0 ba ·
663 sqft ·
Built 1968
· SingleFamily
· Active
· 42 DOM
Cashflow @ list (25.0% down · 7.5%)
Estimated rent
$1,824/mo
Mortgage (P&I)
−$707
Tax + insurance
−$225
HOA
−$372
Vac / Maint / Mgmt
−$383
Net cashflow
$136/mo
Annual
$1,637/yr
Cap rate
7.51%
Cash-on-cash
4.33%
DSCR
1.19
1% rule
1.35%
Cash to close
$37,772
Investor read
- This is a 1-bed/1.0-bath single-family listed at $135k. Condition is rated good.
- At list price, monthly cash flow is $136 ($2k/yr) — positive.
- The deal already cash-flows at list — no discount required.
- Meets the 1% rule at list price ($2k rent vs $135k).
- It's been on market 42 days — a 3% lower offer ($131k) is reasonable based on typical stale-listing flexibility.
- Recommended offer: $131k (3.0% below list) — sets the bar for market timing.
- Local home prices are declining (-3.0%/yr); year-one equity from $933 of loan paydown is wiped out by about $4k of value loss. Plan a longer hold.
- Location reads 64/100 on livability (#416 in NJ) — a middle-class / working-renter tenant base. Strengths: housing A+, crime B+, cost of living B; Watch: schools D, amenities F, commute F.
- Lakewood Township School District (suburban): math 17% / reading 28% proficiency, ranked #417 of 472 in NJ (top 88%) — low school quality limits family demand, transient renter base, plan for 1-2y turnover; 82% free/reduced lunch — lower-income household profile, screen leases tightly.
- Watch-outs: HOA is 20% of rent.
- Market conditions: 419 active listings in the ZIP; 1 comparable units currently listed for rent nearby; 4,434 units permitted in Ocean County in 2024 (868 in 5+ unit buildings).
- Ocean County population projected to shrink 8% by 2050 — rents likely to lag national; underwrite the cash flow, not the appreciation.
- 2 sale attempts; this cycle's ask has dropped $10k (7%) from the opening price — seller is motivated, your offer sets the floor, not the list.
- Climate carrying-cost: major flood risk; major wind risk, 67% chance of damaging wind over 30y; extreme-heat days projected 7→14/yr by 2055 (HVAC capex compounding) — expect insurance premiums to compound above CPI over the hold.
- Cap rate 7.5% vs local median 6.0% in Leisure Village — meaningfully above typical; check what's discounted (condition, days-on-market, listing class) to confirm the premium yield is real.
- This rent runs 34% of the median local income ($65k/yr) — at the standard rent-burdened threshold; future hikes will face affordability resistance.
Questions for listing agent
- It's been on market 42 days. Have you received any prior offers? Is the seller open to a 3% concession, seller financing, or rate buy-down credit?
- Built in 1968 — when were the roof, HVAC, electrical panel, plumbing, and water heater last replaced?
- What does the HOA fee cover, when was the last increase, and are there any pending special assessments or reserve-fund shortfalls?
- Is there a deadline driving the sale (1031 exchange, divorce, estate, relocation)? That informs how much negotiation room exists.
- Schools are D-rated, which usually means shorter tenancies and higher turnover. Who's the typical renter profile here, and what's been the actual vacancy rate?
- What's the average days-on-market for RENTAL listings here right now (not sales)? A rising rental-DOM trend means longer vacancies and softer asking-rent achievability than the comps imply.
- What's the recent tenant-quality profile in this submarket — average credit score on applications, eviction rate, late-payment / NSF rate, and stable-employment percentage? A property-management company in the area should have these aggregated.
- How much new for-sale + rental construction is in the pipeline within 1–3 miles? Heavy new supply typically softens prices + rents 12–24 months out; constrained supply supports both.
CashFlowRE · CFR-KTHJN3CA72H7RT
· Data 1 day ago
cashflowre.app · 2026-05-29