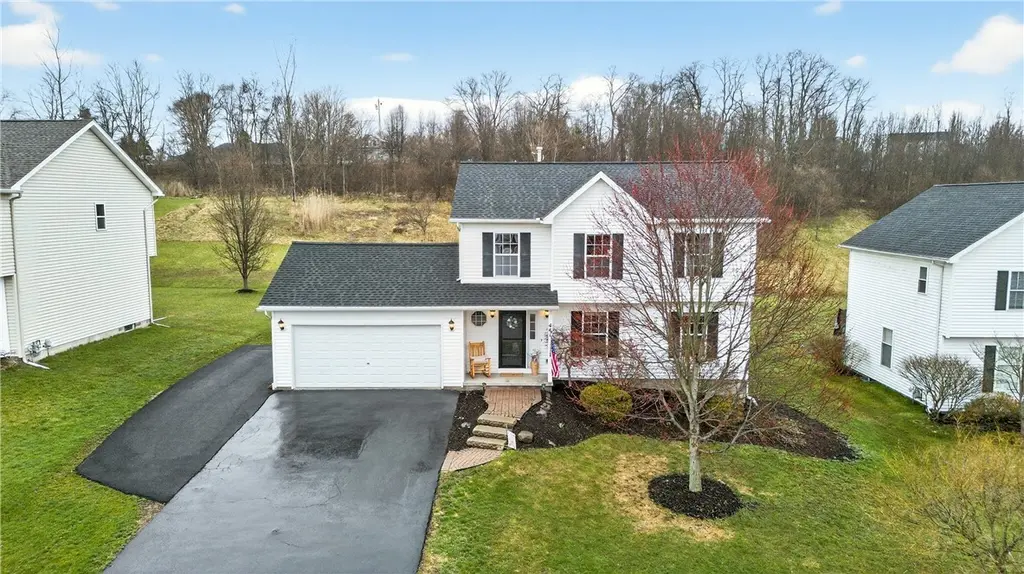
441 Parkside Trl
Gananda, NY 14502
$325,000D
3 bd · 2.5 ba ·
1,556 sqft ·
Built 2006
· SingleFamily
· Pending
· 9 DOM
Cashflow @ list (25.0% down · 7.5%)
Estimated rent
$3,000/mo
Mortgage (P&I)
−$1,704
Tax + insurance
−$779
HOA
−$0
Vac / Maint / Mgmt
−$630
Net cashflow
$-113/mo
Annual
$-1,356/yr
Cap rate
5.88%
Cash-on-cash
-1.49%
DSCR
0.93
1% rule
0.92%
Cash to close
$91,000
Investor read
- This is a 3-bed/2.5-bath single-family listed at $325k.
- At list price, monthly cash flow is $-113 ($-1k/yr) — negative.
- To cash-flow at today's rent, offer at most $305k (6.1% below list).
- To meet the 1% rule (rent ≥ 1% of price), the offer needs to be $300k (7.7% below list).
- Only 9 days on market — expect competitive offers; lowballing is unlikely to land.
- Recommended offer: $300k (7.7% below list) — sets the bar for 1% rule.
- Local home prices are declining (-3.0%/yr); year-one equity from $2k of loan paydown is wiped out by about $10k of value loss. Plan a longer hold.
- Location reads: area grade D — affects rentability + tenant quality, not the cash-flow math above.
- Penfield Central School District (suburban): math 77% / reading 79% proficiency, ranked #67 of 590 in NY (top 11%) — strong family-tenant draw, lease renewals of 3-5y typical; only 11% free/reduced lunch — higher-income household profile.
- Zoned schools: Harris Hill Elementary School (math 87% / reading 87%, grade A+, #69 of 2,108 statewide, top 4%, 427 students, 16% FRL); Bay Trail Middle School (math 59% / reading 78%, grade A, #94 of 729 statewide, top 13%, 1,113 students, 23% FRL); Penfield Senior High School (math 98% / reading 72%, grade A, #369 of 1,100 statewide, top 34%, 1,424 students, 25% FRL).
- Market conditions: 49 active listings in the ZIP; 1 comparable units currently listed for rent nearby; 259 units permitted in Wayne County in 2024 (90 in 5+ unit buildings).
- Wayne County population projected at -24% by 2050 — secular population decline; favor cash flow + early exit over multi-decade hold.
- 3 sale attempts since 13y ago with the ask held roughly flat each time — persistent listings suggest the price (not the market) is what's stuck; bring a comps-based counter.
- Cap rate 5.9% vs local median 3.2% in Gananda — top-decile yield for the area; either an underpriced asset or a hidden risk that comps aren't pricing in. Stress-test before assuming the spread holds.
Questions for listing agent
- What do current leases actually rent for vs. the listed asking? Can we see a recent rent roll and the last 12 months of T-12 income?
- Is there a deadline driving the sale (1031 exchange, divorce, estate, relocation)? That informs how much negotiation room exists.
- The area grade is low — what's the realistic commute time and amenity access for the typical tenant pool here? Any planned neighborhood developments (good or bad) we should know about?
- What's the average days-on-market for RENTAL listings here right now (not sales)? A rising rental-DOM trend means longer vacancies and softer asking-rent achievability than the comps imply.
- What's the recent tenant-quality profile in this submarket — average credit score on applications, eviction rate, late-payment / NSF rate, and stable-employment percentage? A property-management company in the area should have these aggregated.
- How much new for-sale + rental construction is in the pipeline within 1–3 miles? Heavy new supply typically softens prices + rents 12–24 months out; constrained supply supports both.
CashFlowRE · CFR-KV13TD04JH0A21
· Data 4 weeks ago
cashflowre.app · 2026-05-29