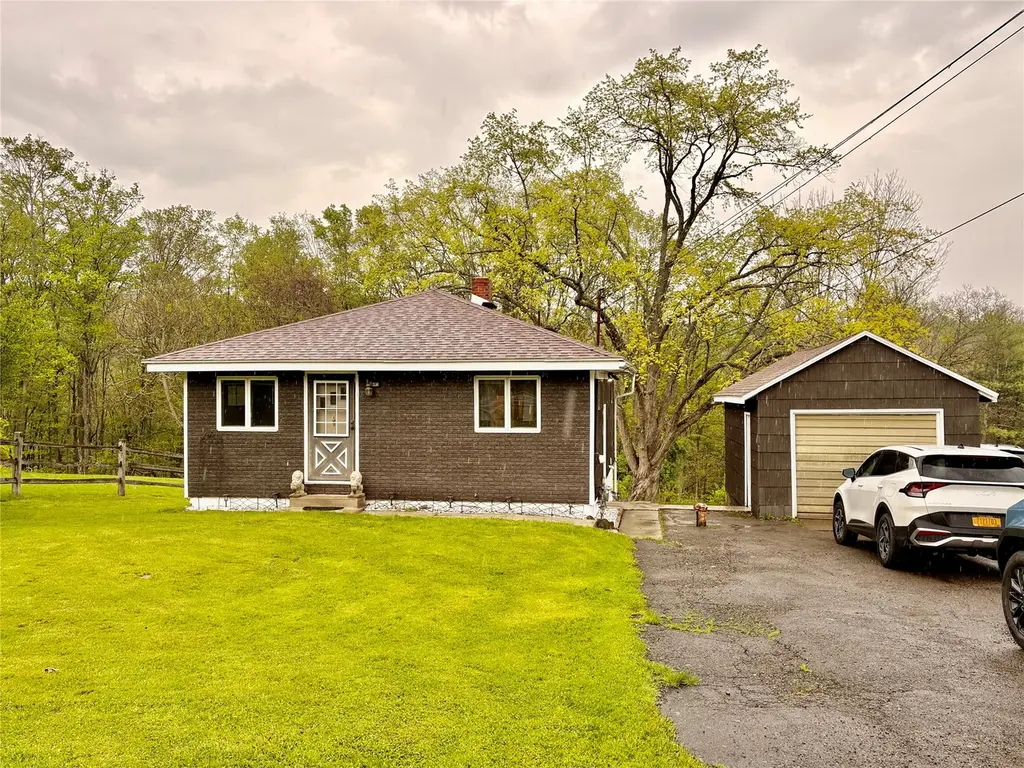
1008 Oakdale Rd
Johnson City, NY 13790
$145,000B-
2 bd · 1.0 ba ·
756 sqft ·
Built 1955
· SingleFamily
· Pending
· 5 DOM
Cashflow @ list (25.0% down · 7.5%)
Estimated rent
$1,455/mo
Mortgage (P&I)
−$760
Tax + insurance
−$283
HOA
−$0
Vac / Maint / Mgmt
−$306
Net cashflow
$106/mo
Annual
$1,269/yr
Cap rate
7.17%
Cash-on-cash
3.13%
DSCR
1.14
1% rule
1.00%
Cash to close
$40,600
Investor read
- This is a 2-bed/1.0-bath single-family listed at $145k.
- At list price, monthly cash flow is $106 ($1k/yr) — positive.
- The deal already cash-flows at list — no discount required.
- Meets the 1% rule at list price ($1k rent vs $145k).
- Only 5 days on market — expect competitive offers; lowballing is unlikely to land.
- In year one you build about $16k of equity ($1k loan paydown + $14k appreciation (10.0% local appreciation)).
- Location reads 76/100 on livability (#238 in NY, #3,739 nationally) — a middle-class / working-renter tenant base. Strengths: cost of living A+, housing A+, health & safety A+; Watch: crime F, employment D-.
- Johnson City Central School District (suburban): math 38% / reading 41% proficiency, ranked #535 of 590 in NY (top 91%) — families likely to look elsewhere, expect single-tenant / working-renter base with shorter leases.
- Zoned schools: Johnson City Elementary/Primary School (496 students, 55% FRL); Johnson City Middle School (math 19% / reading 43%, grade F, #534 of 729 statewide, top 73%, 500 students, 65% FRL); Johnson City Senior High School (math 98% / reading 64%, grade A, #485 of 1,100 statewide, top 45%, 729 students, 60% FRL) — zoned schools at 60% FRL track the district average.
- Zoned-school proficiency averages 56% at this address vs 40% district-wide (+16 pts) — the actual schools serving this property are materially stronger than the Johnson City Central School District average implies; a family-tenant draw the district grade alone would hide.
- Watch-outs: built in 1955 — expect roof / HVAC / electrical / plumbing capex.
- Market conditions: Rents rising fast (+9.5%/yr); 103 active listings in the ZIP; 1 comparable units currently listed for rent nearby; 340 units permitted in Broome County in 2024 (269 in 5+ unit buildings).
- Broome County population projected at -13% by 2050 — secular population decline; favor cash flow + early exit over multi-decade hold.
- At projected returns (10.0% appreciation + 8.0% rent growth), your $41k cash investment doubles in ~3 years — after that, you're playing with house money.
- By year 3, paydown + projected appreciation supports a ~$39k cash-out refi (75% LTV) — recoverable capital for the next deal without selling this one.
Questions for listing agent
- Built in 1955 — when were the roof, HVAC, electrical panel, plumbing, and water heater last replaced?
- Is there a deadline driving the sale (1031 exchange, divorce, estate, relocation)? That informs how much negotiation room exists.
- Crime grade is F in this area — have there been break-ins, vandalism, or insurance claims at this property in the last 3 years? What carrier currently insures it and at what premium?
- What's the average days-on-market for RENTAL listings here right now (not sales)? A rising rental-DOM trend means longer vacancies and softer asking-rent achievability than the comps imply.
- What's the recent tenant-quality profile in this submarket — average credit score on applications, eviction rate, late-payment / NSF rate, and stable-employment percentage? A property-management company in the area should have these aggregated.
- How much new for-sale + rental construction is in the pipeline within 1–3 miles? Heavy new supply typically softens prices + rents 12–24 months out; constrained supply supports both.
CashFlowRE · CFR-KV3ZS9E5V8AWJ5
· Data 4 weeks ago
cashflowre.app · 2026-05-29