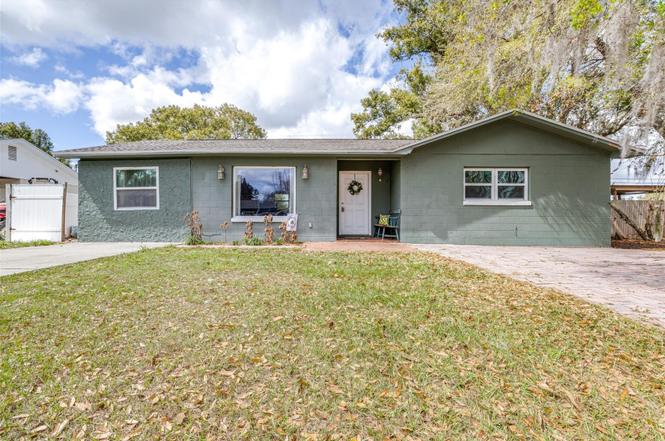
2584 Edmond Cir
Auburndale, FL 33823
$214,900D
3 bd · 1.0 ba ·
1,310 sqft ·
Built 1974
· SingleFamily
· Active
· 107 DOM
Cashflow @ list (25.0% down · 7.5%)
Estimated rent
$1,849/mo
Mortgage (P&I)
−$1,127
Tax + insurance
−$361
HOA
−$0
Vac / Maint / Mgmt
−$388
Net cashflow
$-28/mo
Annual
$-332/yr
Cap rate
6.14%
Cash-on-cash
-0.55%
DSCR
0.98
1% rule
0.86%
Cash to close
$60,172
Investor read
- This is a 3-bed/1.0-bath single-family listed at $215k.
- At list price, monthly cash flow is $-28 ($-332/yr) — negative.
- To cash-flow at today's rent, offer at most $210k (2.3% below list).
- To meet the 1% rule (rent ≥ 1% of price), the offer needs to be $185k (14.0% below list).
- It's been on market 107 days — a 9% lower offer ($196k) is reasonable based on typical stale-listing flexibility.
- Recommended offer: $185k (14.0% below list) — sets the bar for 1% rule.
- Local home prices are declining (-3.0%/yr); year-one equity from $1k of loan paydown is wiped out by about $6k of value loss. Plan a longer hold.
- Location reads 83/100 on livability (#48 in FL, #905 nationally) — a professional / high-income tenant draw. Strengths: cost of living A+, housing A+, health & safety A+; Watch: amenities C-, commute C-.
- Polk (suburban): math 39% / reading 43% proficiency, ranked #62 of 73 in FL (top 85%) — families likely to look elsewhere, expect single-tenant / working-renter base with shorter leases.
- Zoned schools: Clarence Boswell Elementary School (math 45% / reading 35%, grade F, #1,491 of 2,144 statewide, top 70%, 636 students, 62% FRL); Jere L. Stambaugh Middle (math 23% / reading 26%, grade F, #522 of 571 statewide, top 93%, 1,127 students, 65% FRL); Auburndale Senior High School (math 25% / reading 31%, grade F, #464 of 667 statewide, top 70%, 1,716 students, 53% FRL) — zoned schools at 60% FRL track the district average.
- Market conditions: Rents rising (+3.2%/yr); 483 active listings in the ZIP; 10,384 units permitted in Polk County in 2024 (1,716 in 5+ unit buildings).
- Polk County population projected at +33% by 2050 — long-run rental-demand tailwind backs the buy-and-hold thesis.
- 5 sale attempts since 5y ago with the ask held roughly flat each time — persistent listings suggest the price (not the market) is what's stuck; bring a comps-based counter.
- Climate carrying-cost: severe wind risk, 99% chance of damaging wind over 30y; moderate wildfire risk; extreme-heat days projected 7→24/yr by 2055 (HVAC capex compounding) — expect insurance premiums to compound above CPI over the hold.
- This rent runs 31% of the median local income ($71k/yr) — at the standard rent-burdened threshold; future hikes will face affordability resistance.
Questions for listing agent
- What do current leases actually rent for vs. the listed asking? Can we see a recent rent roll and the last 12 months of T-12 income?
- It's been on market 107 days. Have you received any prior offers? Is the seller open to a 14% concession, seller financing, or rate buy-down credit?
- Built in 1974 — when were the roof, HVAC, electrical panel, plumbing, and water heater last replaced?
- Why hasn't it sold? Are there any deal-killer items the seller is aware of (foundation, flood, title, zoning, code violations)?
- Is there a deadline driving the sale (1031 exchange, divorce, estate, relocation)? That informs how much negotiation room exists.
- The area grade is low — what's the realistic commute time and amenity access for the typical tenant pool here? Any planned neighborhood developments (good or bad) we should know about?
- What's the average days-on-market for RENTAL listings here right now (not sales)? A rising rental-DOM trend means longer vacancies and softer asking-rent achievability than the comps imply.
- What's the recent tenant-quality profile in this submarket — average credit score on applications, eviction rate, late-payment / NSF rate, and stable-employment percentage? A property-management company in the area should have these aggregated.
CashFlowRE · CFR-KYYNRJ5B61A0TP
· Data 17 h ago
cashflowre.app · 2026-05-29