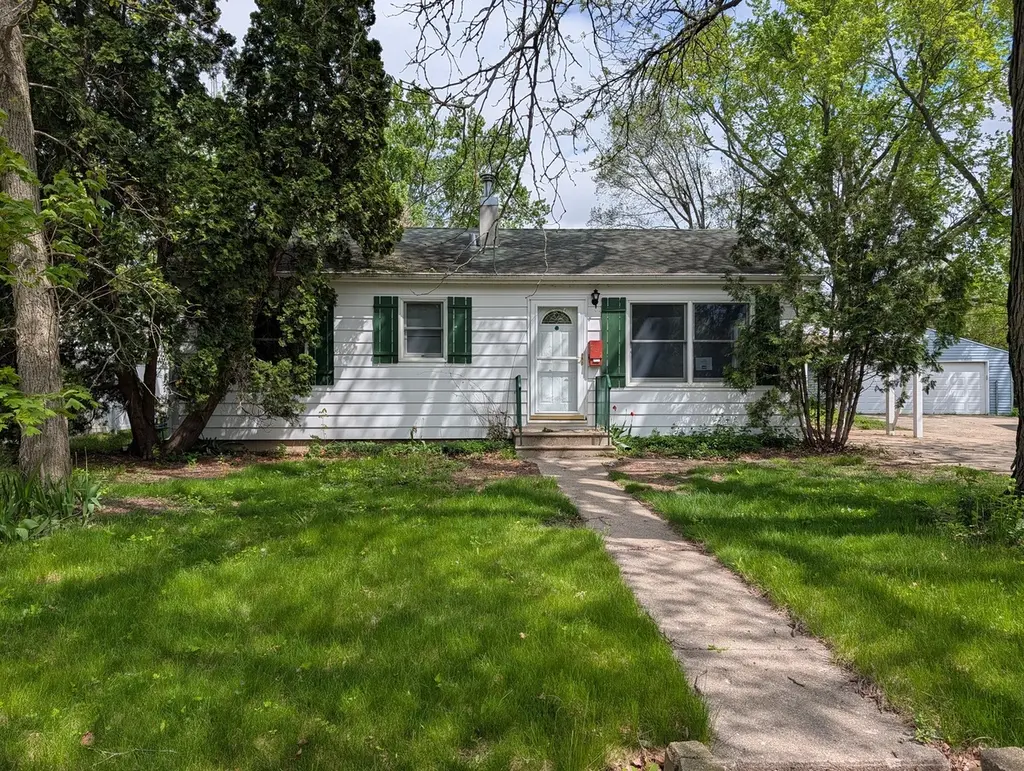
231 River Dr
DeKalb, IL 60115
$183,000D
3 bd · 2.0 ba ·
1,547 sqft ·
Built 1959
· Other
· Pending
· 6 DOM
Cashflow @ list (25.0% down · 7.5%)
Estimated rent
$1,904/mo
Mortgage (P&I)
−$960
Tax + insurance
−$572
HOA
−$0
Vac / Maint / Mgmt
−$400
Net cashflow
$-28/mo
Annual
$-335/yr
Cap rate
6.11%
Cash-on-cash
-0.65%
DSCR
0.97
1% rule
1.04%
Cash to close
$51,240
Investor read
- This is a 3-bed/2.0-bath other listed at $183k.
- At list price, monthly cash flow is $-28 ($-335/yr) — negative.
- To cash-flow at today's rent, offer at most $178k (2.7% below list).
- Meets the 1% rule at list price ($2k rent vs $183k).
- Only 6 days on market — expect competitive offers; lowballing is unlikely to land.
- Recommended offer: $178k (2.7% below list) — sets the bar for cash-flow.
- Local home prices are declining (-3.0%/yr); year-one equity from $1k of loan paydown is wiped out by about $5k of value loss. Plan a longer hold.
- Location reads 77/100 on livability (#154 in IL, #2,835 nationally) — a middle-class / working-renter tenant base. Strengths: commute A+, cost of living A+, housing A+; Watch: amenities D+, schools D, crime D-.
- Dekalb CUSD 428 (suburban): math 11% / reading 16% proficiency, ranked #541 of 620 in IL (top 87%) — low school quality limits family demand, transient renter base, plan for 1-2y turnover.
- Watch-outs: property tax is 3.3% of price; built in 1959 — expect roof / HVAC / electrical / plumbing capex.
- Market conditions: Rents rising fast (+7.3%/yr); 85 active listings in the ZIP; 7 comparable units currently listed for rent nearby; rentals lingering (median 44d on market — plan ~5-8 weeks vacancy on turnover, expect pricing pressure); 71% of comp listings sitting > 30 days — soft ceiling on asking rent; 260 units permitted in DeKalb County in 2024 (73 in 5+ unit buildings).
- DeKalb County population projected to shrink 5% by 2050 — rents likely to lag national; underwrite the cash flow, not the appreciation.
- 3 sale attempts since 5y ago with the ask held roughly flat each time — persistent listings suggest the price (not the market) is what's stuck; bring a comps-based counter.
- Cap rate 6.1% vs local median 4.4% in DeKalb — top-decile yield for the area; either an underpriced asset or a hidden risk that comps aren't pricing in. Stress-test before assuming the spread holds.
- At $1,904/mo this rent would consume 49% of the median local household income ($47k/yr) (locally 3794% of renters already pay >50% of income on rent) — very limited rent-growth headroom before tenants either downsize or default.
Questions for listing agent
- What do current leases actually rent for vs. the listed asking? Can we see a recent rent roll and the last 12 months of T-12 income?
- Built in 1959 — when were the roof, HVAC, electrical panel, plumbing, and water heater last replaced?
- Property tax is high relative to price — has the assessment been appealed recently, and will the sale trigger a re-assessment?
- Is there a deadline driving the sale (1031 exchange, divorce, estate, relocation)? That informs how much negotiation room exists.
- Schools are D-rated, which usually means shorter tenancies and higher turnover. Who's the typical renter profile here, and what's been the actual vacancy rate?
- Crime grade is D in this area — have there been break-ins, vandalism, or insurance claims at this property in the last 3 years? What carrier currently insures it and at what premium?
- The area grade is low — what's the realistic commute time and amenity access for the typical tenant pool here? Any planned neighborhood developments (good or bad) we should know about?
- What's the average days-on-market for RENTAL listings here right now (not sales)? A rising rental-DOM trend means longer vacancies and softer asking-rent achievability than the comps imply.
CashFlowRE · CFR-M0E021CFV3WVW0
· Data 1 week ago
cashflowre.app · 2026-05-29