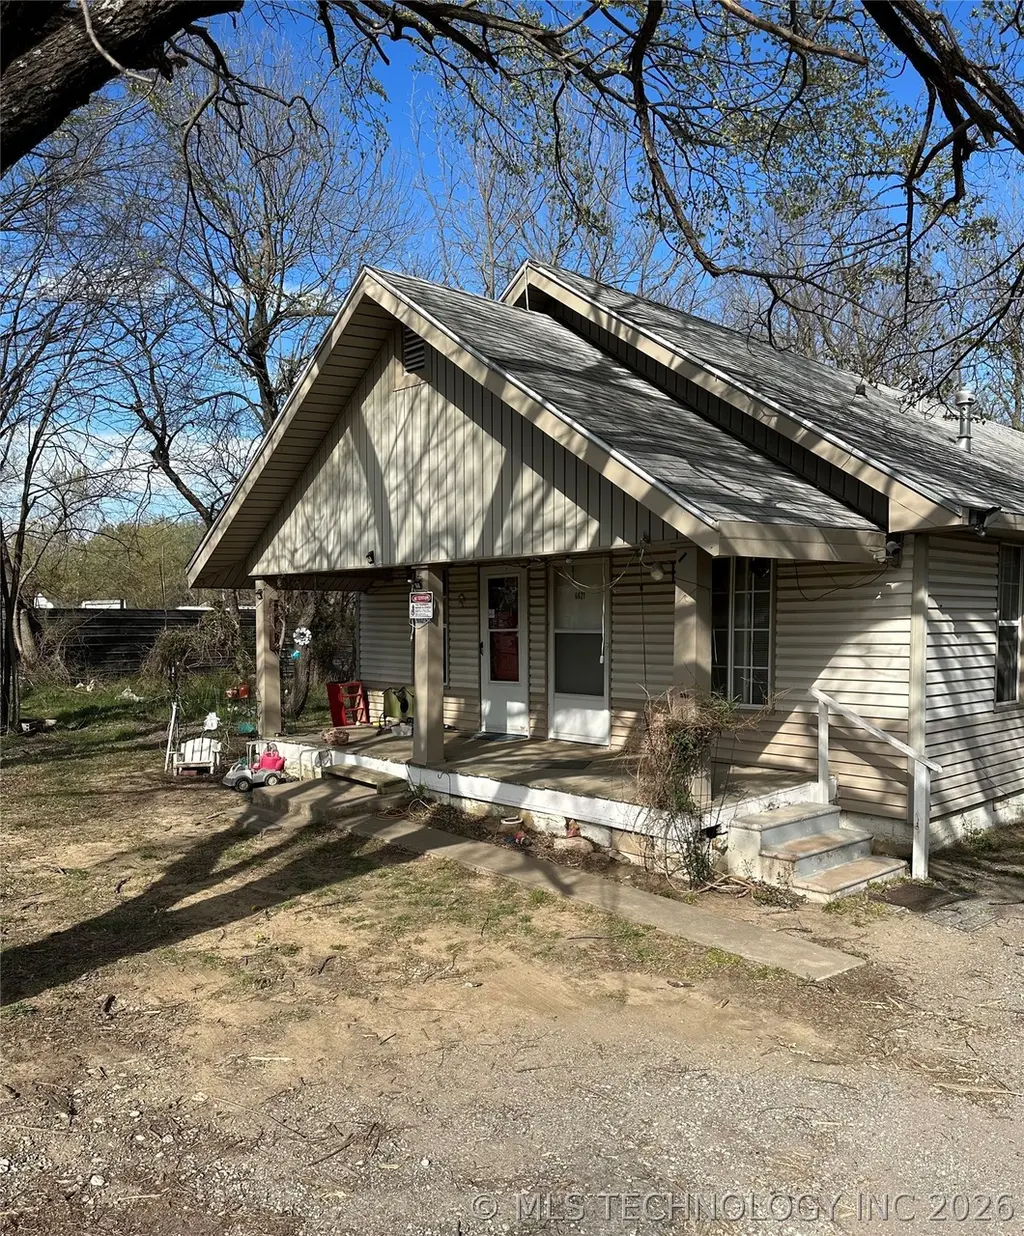
6621 N Peoria Ave
Turley, OK 74126
$99,000C+
2 bd · 2.0 ba ·
1,300 sqft ·
Built 1935
· Townhouse
· Active
· 66 DOM
Cashflow @ list (25.0% down · 7.5%)
Estimated rent
$1,202/mo
Mortgage (P&I)
−$519
Tax + insurance
−$74
HOA
−$0
Vac / Maint / Mgmt
−$252
Net cashflow
$356/mo
Annual
$4,277/yr
Cap rate
10.61%
Cash-on-cash
15.43%
DSCR
1.69
1% rule
1.21%
Cash to close
$27,720
Investor read
- This is a 2-bed/2.0-bath townhouse listed at $99k.
- At list price, monthly cash flow is $356 ($4k/yr) — positive.
- The deal already cash-flows at list — no discount required.
- Meets the 1% rule at list price ($1k rent vs $99k).
- It's been on market 66 days — a 6% lower offer ($93k) is reasonable based on typical stale-listing flexibility.
- Recommended offer: $93k (6.0% below list) — sets the bar for market timing.
- Local home prices are declining (-3.0%/yr); year-one equity from $684 of loan paydown is wiped out by about $3k of value loss. Plan a longer hold.
- Location reads 67/100 on livability (#98 in OK) — a middle-class / working-renter tenant base. Strengths: commute A+, cost of living A+, housing A+; Watch: schools F, amenities F, employment F.
- Tulsa (urban): math 7% / reading 12% proficiency, ranked #250 of 270 in OK (top 93%) — low school quality limits family demand, transient renter base, plan for 1-2y turnover; 76% free/reduced lunch — lower-income household profile, screen leases tightly.
- Watch-outs: built in 1935 — expect roof / HVAC / electrical / plumbing capex.
- Market conditions: 70 active listings in the ZIP; 7 comparable units currently listed for rent nearby; rentals leasing fast (median 2d on market — plan ~1-2 weeks tenant-placement turnaround); lower-income renter base — watch delinquency; 2,818 units permitted in Tulsa County in 2024 (518 in 5+ unit buildings).
- Tulsa County population projected at +30% by 2050 — long-run rental-demand tailwind backs the buy-and-hold thesis.
- 4 sale attempts with the ask held roughly flat each time — persistent listings suggest the price (not the market) is what's stuck; bring a comps-based counter.
- At projected returns (-3.0% appreciation + 3.0% rent growth), your $28k cash investment doubles in ~8 years — after that, you're playing with house money.
- Climate carrying-cost: moderate flood risk; moderate wildfire risk; extreme-heat days projected 7→18/yr by 2055 (HVAC capex compounding) — expect insurance premiums to compound above CPI over the hold.
- This rent runs 34% of the median local income ($42k/yr) — at the standard rent-burdened threshold; future hikes will face affordability resistance.
Questions for listing agent
- It's been on market 66 days. Have you received any prior offers? Is the seller open to a 6% concession, seller financing, or rate buy-down credit?
- Built in 1935 — when were the roof, HVAC, electrical panel, plumbing, and water heater last replaced?
- Why hasn't it sold? Are there any deal-killer items the seller is aware of (foundation, flood, title, zoning, code violations)?
- Is there a deadline driving the sale (1031 exchange, divorce, estate, relocation)? That informs how much negotiation room exists.
- Schools are F-rated, which usually means shorter tenancies and higher turnover. Who's the typical renter profile here, and what's been the actual vacancy rate?
- What's the average days-on-market for RENTAL listings here right now (not sales)? A rising rental-DOM trend means longer vacancies and softer asking-rent achievability than the comps imply.
- What's the recent tenant-quality profile in this submarket — average credit score on applications, eviction rate, late-payment / NSF rate, and stable-employment percentage? A property-management company in the area should have these aggregated.
- How much new for-sale + rental construction is in the pipeline within 1–3 miles? Heavy new supply typically softens prices + rents 12–24 months out; constrained supply supports both.
CashFlowRE · CFR-M1CTBEDNFX2F91
· Data 2 days ago
cashflowre.app · 2026-05-29