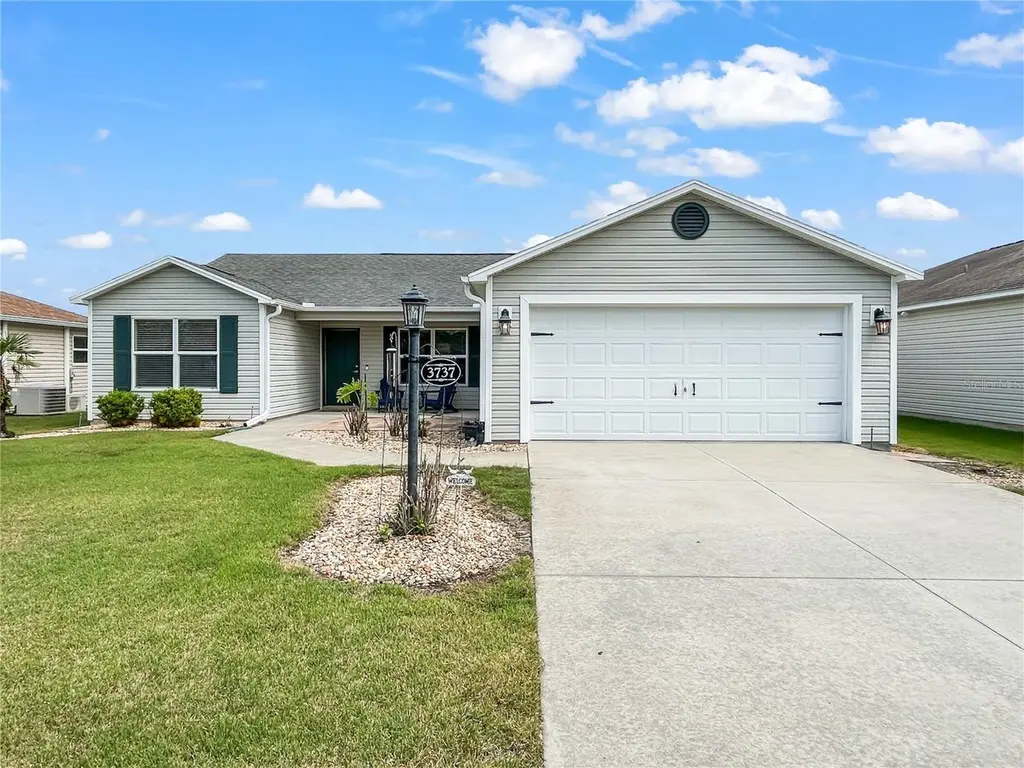
3737 Cosmos Way
The Villages, FL 32163
$329,900C-
3 bd · 2.0 ba ·
1,392 sqft ·
Built 2013
· SingleFamily
· Active
· 80 DOM
Cashflow @ list (25.0% down · 7.5%)
Estimated rent
$2,922/mo
Mortgage (P&I)
−$1,730
Tax + insurance
−$450
HOA
−$205
Vac / Maint / Mgmt
−$614
Net cashflow
$-76/mo
Annual
$-918/yr
Cap rate
6.01%
Cash-on-cash
-0.99%
DSCR
0.96
1% rule
0.89%
Cash to close
$92,372
Investor read
- This is a 3-bed/2.0-bath single-family listed at $330k.
- At list price, monthly cash flow is $-76 ($-918/yr) — negative.
- To cash-flow at today's rent, offer at most $316k (4.1% below list).
- To meet the 1% rule (rent ≥ 1% of price), the offer needs to be $292k (11.4% below list).
- It's been on market 80 days — a 6% lower offer ($310k) is reasonable based on typical stale-listing flexibility.
- Recommended offer: $292k (11.4% below list) — sets the bar for 1% rule.
- In year one you build about $35k of equity ($2k loan paydown + $33k appreciation (10.0% local appreciation)).
- Location reads 70/100 on livability (#431 in FL) — a middle-class / working-renter tenant base. Strengths: schools A+, crime A+, housing A; Watch: amenities F, commute F, health & safety F.
- Sumter (rural): math 61% / reading 61% proficiency, ranked #11 of 73 in FL (top 15%) — acceptable for families but not a draw, mixed tenant base, ~2y average lease.
- Market conditions: 265 active listings in the ZIP; 8 comparable units currently listed for rent nearby; rentals at typical pace (median 22d on market — plan ~3-4 weeks tenant-placement turnaround); solid renter incomes; 3,961 units permitted in Sumter County in 2024 (248 in 5+ unit buildings).
- Sumter County population projected at +45% by 2050 — long-run rental-demand tailwind backs the buy-and-hold thesis.
- Current owner paid $200k; list at $330k implies a 65% gain — meaningful room to come down on a strong offer.
- At projected returns (10.0% appreciation + 3.0% rent growth), your $92k cash investment doubles in ~3 years — after that, you're playing with house money.
- By year 2, paydown + projected appreciation supports a ~$57k cash-out refi (75% LTV) — recoverable capital for the next deal without selling this one.
- Climate carrying-cost: severe wind risk, 99% chance of damaging wind over 30y; extreme-heat days projected 7→23/yr by 2055 (HVAC capex compounding) — expect insurance premiums to compound above CPI over the hold.
- Cap rate 6.0% vs local median 5.0% in The Villages — meaningfully above typical; check what's discounted (condition, days-on-market, listing class) to confirm the premium yield is real.
- This rent runs 36% of the median local income ($97k/yr) — at the standard rent-burdened threshold; future hikes will face affordability resistance.
Questions for listing agent
- What do current leases actually rent for vs. the listed asking? Can we see a recent rent roll and the last 12 months of T-12 income?
- It's been on market 80 days. Have you received any prior offers? Is the seller open to a 11% concession, seller financing, or rate buy-down credit?
- What does the HOA fee cover, when was the last increase, and are there any pending special assessments or reserve-fund shortfalls?
- Why hasn't it sold? Are there any deal-killer items the seller is aware of (foundation, flood, title, zoning, code violations)?
- Is there a deadline driving the sale (1031 exchange, divorce, estate, relocation)? That informs how much negotiation room exists.
- Schools are A-rated — typically a magnet for longer-tenancy family renters. What's the average tenant stay here, and is there a school-zone premium baked into asking?
- What's the average days-on-market for RENTAL listings here right now (not sales)? A rising rental-DOM trend means longer vacancies and softer asking-rent achievability than the comps imply.
- What's the recent tenant-quality profile in this submarket — average credit score on applications, eviction rate, late-payment / NSF rate, and stable-employment percentage? A property-management company in the area should have these aggregated.
CashFlowRE · CFR-M3B9T64TEBZH26
· Data 2 days ago
cashflowre.app · 2026-05-29