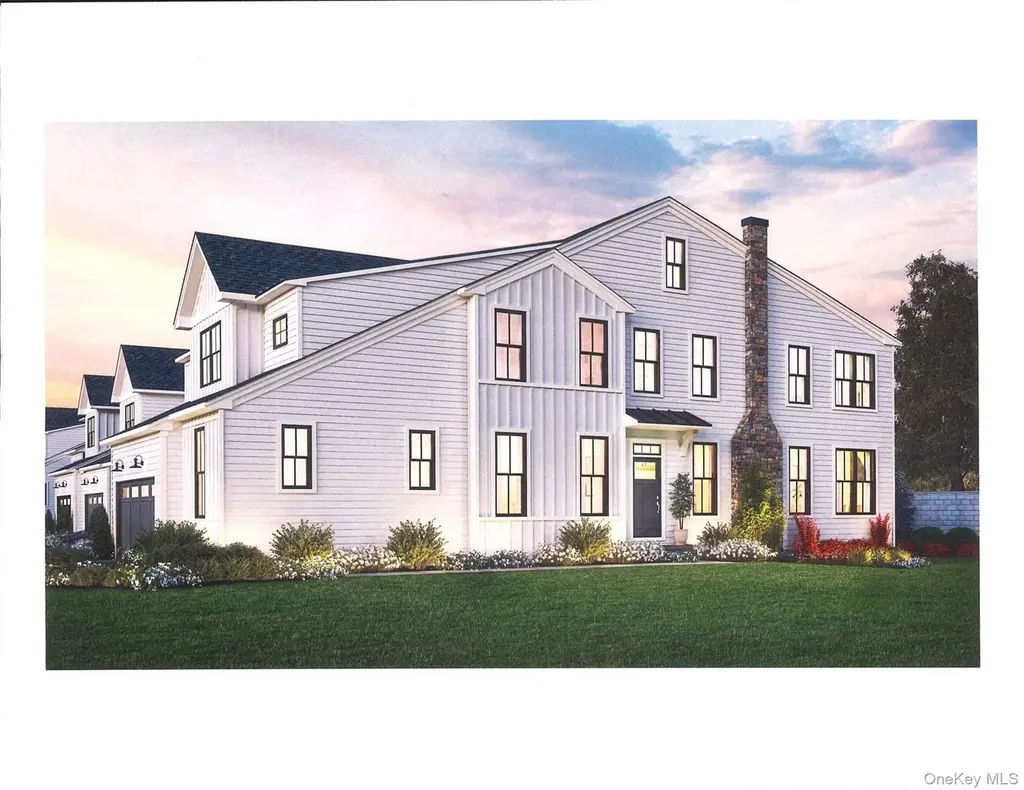
25 Fieldstone #35
Armonk, NY 10504
$1,579,000D
3 bd · 2.5 ba ·
2,681 sqft ·
Built 2026
· SingleFamily
· Active
· 112 DOM
Cashflow @ list (25.0% down · 7.5%)
Estimated rent
$13,950/mo
Mortgage (P&I)
−$8,280
Tax + insurance
−$2,632
HOA
−$345
Vac / Maint / Mgmt
−$2,930
Net cashflow
$-237/mo
Annual
$-2,839/yr
Cap rate
6.11%
Cash-on-cash
-0.64%
DSCR
0.97
1% rule
0.88%
Cash to close
$442,120
Investor read
- This is a 3-bed/2.5-bath single-family listed at $1.58M. Condition is rated excellent.
- At list price, monthly cash flow is $-237 ($-3k/yr) — negative.
- To cash-flow at today's rent, offer at most $1.54M (2.2% below list).
- To meet the 1% rule (rent ≥ 1% of price), the offer needs to be $1.40M (11.7% below list).
- It's been on market 112 days — a 9% lower offer ($1.44M) is reasonable based on typical stale-listing flexibility.
- Recommended offer: $1.40M (11.7% below list) — sets the bar for 1% rule.
- Local home prices are declining (-3.0%/yr); year-one equity from $11k of loan paydown is wiped out by about $47k of value loss. Plan a longer hold.
- Location reads 67/100 on livability (#597 in NY) — a middle-class / working-renter tenant base. Strengths: crime A+, employment A+, housing A-; Watch: amenities F, commute F, cost of living F.
- Byram Hills Central School District (suburban): math 79% / reading 86% proficiency, ranked #17 of 590 in NY (top 3%) — strong family-tenant draw, lease renewals of 3-5y typical; only 2% free/reduced lunch — higher-income household profile.
- Zoned schools: Coman Hill School (563 students, 4% FRL); H C Crittenden Middle School (math 77% / reading 85%, grade A+, #24 of 729 statewide, top 3%, 532 students, 0% FRL); Byram Hills High School (math 77% / reading 95%, grade A, #347 of 1,100 statewide, top 32%, 710 students, 0% FRL) — zoned schools at 1% FRL track the district average.
- Market conditions: 111 active listings in the ZIP; 1 comparable units currently listed for rent nearby; 954 units permitted in Westchester County in 2024 (649 in 5+ unit buildings).
- Westchester County population projected at +10% by 2050 — modest demand growth; plan on rents tracking national, not racing it.
- Cap rate 6.1% vs local median 0.3% in Armonk — top-decile yield for the area; either an underpriced asset or a hidden risk that comps aren't pricing in. Stress-test before assuming the spread holds.
Questions for listing agent
- What do current leases actually rent for vs. the listed asking? Can we see a recent rent roll and the last 12 months of T-12 income?
- It's been on market 112 days. Have you received any prior offers? Is the seller open to a 12% concession, seller financing, or rate buy-down credit?
- What does the HOA fee cover, when was the last increase, and are there any pending special assessments or reserve-fund shortfalls?
- Why hasn't it sold? Are there any deal-killer items the seller is aware of (foundation, flood, title, zoning, code violations)?
- Is there a deadline driving the sale (1031 exchange, divorce, estate, relocation)? That informs how much negotiation room exists.
- Schools are A-rated — typically a magnet for longer-tenancy family renters. What's the average tenant stay here, and is there a school-zone premium baked into asking?
- The area grade is low — what's the realistic commute time and amenity access for the typical tenant pool here? Any planned neighborhood developments (good or bad) we should know about?
- What's the average days-on-market for RENTAL listings here right now (not sales)? A rising rental-DOM trend means longer vacancies and softer asking-rent achievability than the comps imply.
CashFlowRE · CFR-M4HCY08ZZ5VEY9
· Data 1 day ago
cashflowre.app · 2026-05-29