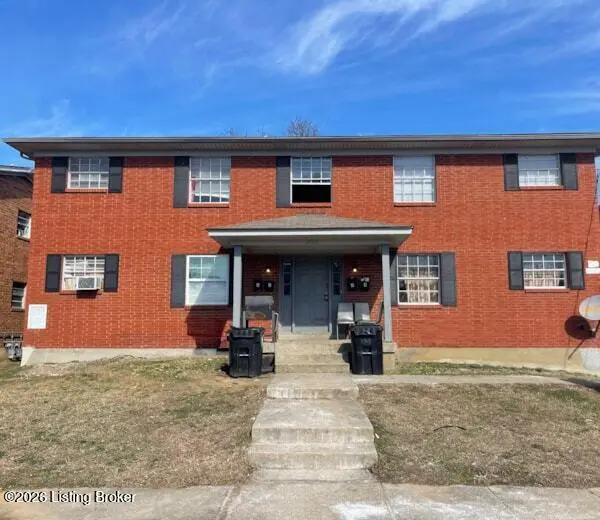
1707 Liberty Bell Way
Louisville, KY 40215
$290,000B-
8 bd · 4.0 ba ·
3,430 sqft ·
Built 1967
· MultiFamily
· Active
· 38 DOM
Cashflow @ list (25.0% down · 7.5%)
Estimated rent
$4,360/mo
Mortgage (P&I)
−$1,521
Tax + insurance
−$436
HOA
−$0
Vac / Maint / Mgmt
−$916
Net cashflow
$1,488/mo
Annual
$17,853/yr
Cap rate
12.45%
Cash-on-cash
21.99%
DSCR
1.98
1% rule
1.50%
Cash to close
$81,200
Investor read
- This is a 4 × 2-bed/1.0-bath units multifamily listed at $290k.
- At list price, monthly cash flow is $1k ($18k/yr) — positive. Per door: $372/mo.
- The deal already cash-flows at list — no discount required.
- Meets the 1% rule at list price ($4k rent vs $290k).
- It's been on market 38 days — a 3% lower offer ($281k) is reasonable based on typical stale-listing flexibility.
- Recommended offer: $281k (3.0% below list) — sets the bar for market timing.
- Local home prices are declining (-3.0%/yr); year-one equity from $2k of loan paydown is wiped out by about $9k of value loss. Plan a longer hold.
- Location reads 63/100 on livability (#333 in KY) — a middle-class / working-renter tenant base. Strengths: cost of living A+, housing A+; Watch: employment C-, health & safety D+, schools D-.
- Jefferson County (urban): math 19% / reading 35% proficiency, ranked #121 of 165 in KY (top 73%) — low school quality limits family demand, transient renter base, plan for 1-2y turnover.
- Market conditions: Rents rising fast (+5.2%/yr); 121 active listings in the ZIP; lower-income renter base — watch delinquency; 2,836 units permitted in Jefferson County in 2024 (1,558 in 5+ unit buildings).
- Jefferson County population projected at +13% by 2050 — modest demand growth; plan on rents tracking national, not racing it.
- At projected returns (-3.0% appreciation + 5.2% rent growth), your $81k cash investment doubles in ~6 years — after that, you're playing with house money.
- Climate carrying-cost: extreme-heat days projected 7→20/yr by 2055 (HVAC capex compounding) — expect insurance premiums to compound above CPI over the hold.
- Cap rate 12.4% vs local median 5.0% in Louisville — top-decile yield for the area; either an underpriced asset or a hidden risk that comps aren't pricing in. Stress-test before assuming the spread holds.
- At $4,360/mo this rent would consume 120% of the median local household income ($44k/yr) (locally 997% of renters already pay >50% of income on rent) — very limited rent-growth headroom before tenants either downsize or default.
Questions for listing agent
- It's been on market 38 days. Have you received any prior offers? Is the seller open to a 3% concession, seller financing, or rate buy-down credit?
- Can we see the unit-by-unit rent roll, current vacancy, and any below-market leases? What's the average tenancy length?
- What capital expenditures (roof, boiler, parking lot, exteriors) have been made in the last 5 years, and what's planned in the next 2?
- Built in 1967 — when were the roof, HVAC, electrical panel, plumbing, and water heater last replaced?
- Is there a deadline driving the sale (1031 exchange, divorce, estate, relocation)? That informs how much negotiation room exists.
- Schools are D-rated, which usually means shorter tenancies and higher turnover. Who's the typical renter profile here, and what's been the actual vacancy rate?
- Crime grade is F in this area — have there been break-ins, vandalism, or insurance claims at this property in the last 3 years? What carrier currently insures it and at what premium?
- What's the average days-on-market for RENTAL listings here right now (not sales)? A rising rental-DOM trend means longer vacancies and softer asking-rent achievability than the comps imply.
CashFlowRE · CFR-MA4M62AQJT27K4
· Data 2 days ago
cashflowre.app · 2026-05-29