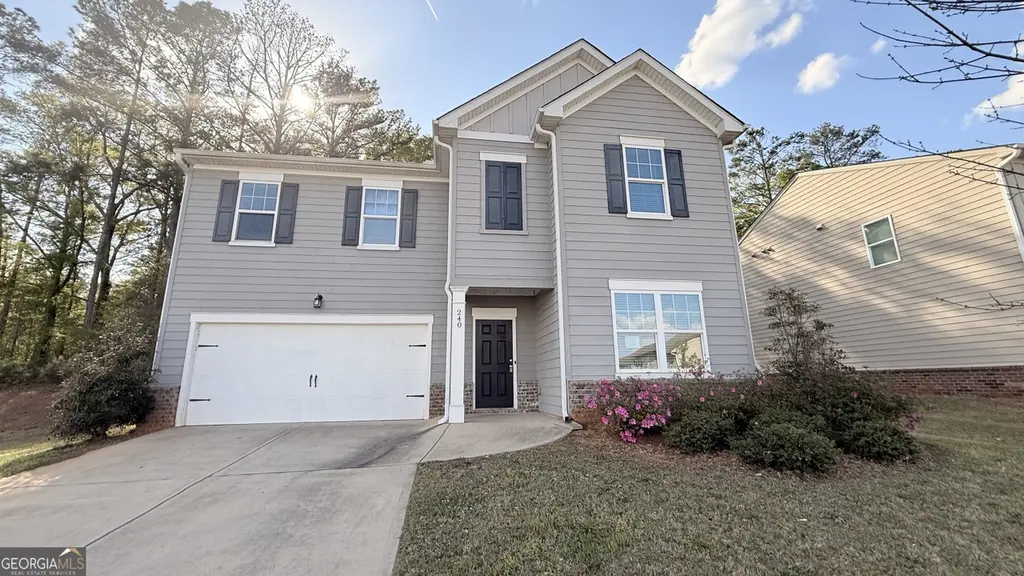
240 Randette Drs
Porterdale, GA 30016
$286,500C
5 bd · 3.0 ba ·
2,772 sqft ·
Built 2020
· SingleFamily
· Active
· 11 DOM
Cashflow @ list (25.0% down · 7.5%)
Estimated rent
$2,870/mo
Mortgage (P&I)
−$1,502
Tax + insurance
−$415
HOA
−$35
Vac / Maint / Mgmt
−$603
Net cashflow
$315/mo
Annual
$3,779/yr
Cap rate
7.61%
Cash-on-cash
4.71%
DSCR
1.21
1% rule
1.00%
Cash to close
$80,220
Investor read
- This is a 5-bed/3.0-bath single-family listed at $286k. Condition is rated fair.
- At list price, monthly cash flow is $315 ($4k/yr) — positive.
- The deal already cash-flows at list — no discount required.
- Meets the 1% rule at list price ($3k rent vs $286k).
- Only 11 days on market — expect competitive offers; lowballing is unlikely to land.
- Local home prices are declining (-3.0%/yr); year-one equity from $2k of loan paydown is wiped out by about $9k of value loss. Plan a longer hold.
- Location reads 58/100 on livability (#447 in GA) — a working-class tenant base; expect higher turnover. Strengths: cost of living A+, crime B+, housing B; Watch: amenities F, commute F, employment F.
- Newton County (suburban): math 17% / reading 26% proficiency, ranked #137 of 174 in GA (top 79%) — low school quality limits family demand, transient renter base, plan for 1-2y turnover.
- Zoned schools: South Salem Elementary School (math 8% / reading 15%, grade F, #1,069 of 1,228 statewide, top 87%, 852 students, 85% FRL); Newton High School (math 8% / reading 12%, grade F, #365 of 424 statewide, top 88%, 2,472 students, 85% FRL) — zoned schools average 85% FRL vs 59% district-wide (26 pts higher); higher-poverty schools than district average — tighter screening recommended.
- Market conditions: Rents rising (+1.8%/yr); 419 active listings in the ZIP; 6 comparable units currently listed for rent nearby; rentals at typical pace (median 22d on market — plan ~3-4 weeks tenant-placement turnaround); solid renter incomes; 1,480 units permitted in Newton County in 2024 (702 in 5+ unit buildings).
- Newton County population projected at +23% by 2050 — long-run rental-demand tailwind backs the buy-and-hold thesis.
- 3 sale attempts with the ask held roughly flat each time — persistent listings suggest the price (not the market) is what's stuck; bring a comps-based counter.
- Cap rate 7.6% vs local median 5.1% in Porterdale — top-decile yield for the area; either an underpriced asset or a hidden risk that comps aren't pricing in. Stress-test before assuming the spread holds.
- This rent runs 43% of the median local income ($80k/yr) — at the standard rent-burdened threshold; future hikes will face affordability resistance.
Questions for listing agent
- Have any recent inspections been done? Can we get a copy of the seller's disclosures and any deferred-maintenance estimates?
- What does the HOA fee cover, when was the last increase, and are there any pending special assessments or reserve-fund shortfalls?
- Is there a deadline driving the sale (1031 exchange, divorce, estate, relocation)? That informs how much negotiation room exists.
- Schools are F-rated, which usually means shorter tenancies and higher turnover. Who's the typical renter profile here, and what's been the actual vacancy rate?
- What's the average days-on-market for RENTAL listings here right now (not sales)? A rising rental-DOM trend means longer vacancies and softer asking-rent achievability than the comps imply.
- What's the recent tenant-quality profile in this submarket — average credit score on applications, eviction rate, late-payment / NSF rate, and stable-employment percentage? A property-management company in the area should have these aggregated.
- How much new for-sale + rental construction is in the pipeline within 1–3 miles? Heavy new supply typically softens prices + rents 12–24 months out; constrained supply supports both.
Repairs flagged (vision-AI assessment)
- Major: concrete floors — concrete floors in living areas
- Major: paint — paint peeling, visible damage
- Major: wall repairs — paint peeling, visible damage
CashFlowRE · CFR-MBG50M2DRNFNY8
· Data 2 days ago
cashflowre.app · 2026-05-29