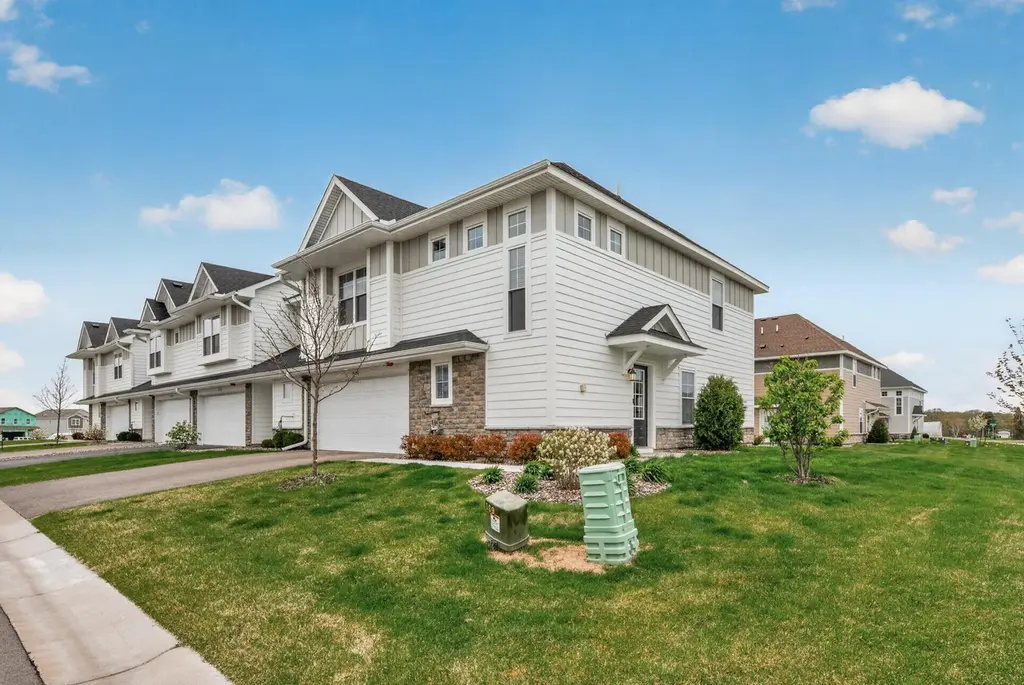
14530 112th Ave N
Dayton, MN 55369
$354,900D-
3 bd · 3.0 ba ·
1,906 sqft ·
Built 2022
· Townhouse
· Active
· 42 DOM
Cashflow @ list (25.0% down · 7.5%)
Estimated rent
$2,862/mo
Mortgage (P&I)
−$1,861
Tax + insurance
−$497
HOA
−$370
Vac / Maint / Mgmt
−$601
Net cashflow
$-467/mo
Annual
$-5,608/yr
Cap rate
4.71%
Cash-on-cash
-5.64%
DSCR
0.75
1% rule
0.81%
Cash to close
$99,372
Investor read
- This is a 3-bed/3.0-bath townhouse listed at $355k. Condition is rated fair.
- At list price, monthly cash flow is $-467 ($-6k/yr) — negative.
- To cash-flow at today's rent, offer at most $272k (23.3% below list).
- To meet the 1% rule (rent ≥ 1% of price), the offer needs to be $286k (19.4% below list).
- It's been on market 42 days — a 3% lower offer ($344k) is reasonable based on typical stale-listing flexibility.
- Recommended offer: $272k (23.3% below list) — sets the bar for cash-flow.
- Local home prices are declining (-3.0%/yr); year-one equity from $2k of loan paydown is wiped out by about $11k of value loss. Plan a longer hold.
- Location reads 70/100 on livability (#337 in MN) — a middle-class / working-renter tenant base. Strengths: crime A+, employment A+, housing A+; Watch: amenities F, commute F, cost of living F.
- Anoka-Hennepin Public School District (suburban): math 49% / reading 55% proficiency, ranked #71 of 301 in MN (top 24%) — acceptable for families but not a draw, mixed tenant base, ~2y average lease.
- Market conditions: Rents rising (+2.3%/yr); 382 active listings in the ZIP; 4 comparable units currently listed for rent nearby; rentals leasing fast (median 13d on market — plan ~1-2 weeks tenant-placement turnaround); high-income renter base; 4,651 units permitted in Hennepin County in 2024 (2,443 in 5+ unit buildings).
- Hennepin County population projected at +30% by 2050 — long-run rental-demand tailwind backs the buy-and-hold thesis.
- 3 sale attempts since 3y ago; this cycle's ask has dropped $20k (5%) from the opening price — seller is motivated, your offer sets the floor, not the list.
- Cap rate 4.7% vs local median 2.5% in Dayton — top-decile yield for the area; either an underpriced asset or a hidden risk that comps aren't pricing in. Stress-test before assuming the spread holds.
- This rent runs 31% of the median local income ($112k/yr) — at the standard rent-burdened threshold; future hikes will face affordability resistance.
Questions for listing agent
- What do current leases actually rent for vs. the listed asking? Can we see a recent rent roll and the last 12 months of T-12 income?
- It's been on market 42 days. Have you received any prior offers? Is the seller open to a 23% concession, seller financing, or rate buy-down credit?
- Have any recent inspections been done? Can we get a copy of the seller's disclosures and any deferred-maintenance estimates?
- What does the HOA fee cover, when was the last increase, and are there any pending special assessments or reserve-fund shortfalls?
- Is there a deadline driving the sale (1031 exchange, divorce, estate, relocation)? That informs how much negotiation room exists.
- Schools are A-rated — typically a magnet for longer-tenancy family renters. What's the average tenant stay here, and is there a school-zone premium baked into asking?
- The area grade is low — what's the realistic commute time and amenity access for the typical tenant pool here? Any planned neighborhood developments (good or bad) we should know about?
- What's the average days-on-market for RENTAL listings here right now (not sales)? A rising rental-DOM trend means longer vacancies and softer asking-rent achievability than the comps imply.
Repairs flagged (vision-AI assessment)
- Minor: Landscaping — Some areas of the lawn appear slightly overgrown
CashFlowRE · CFR-MBPE3V7XW75FT4
· Data 2 days ago
cashflowre.app · 2026-05-29