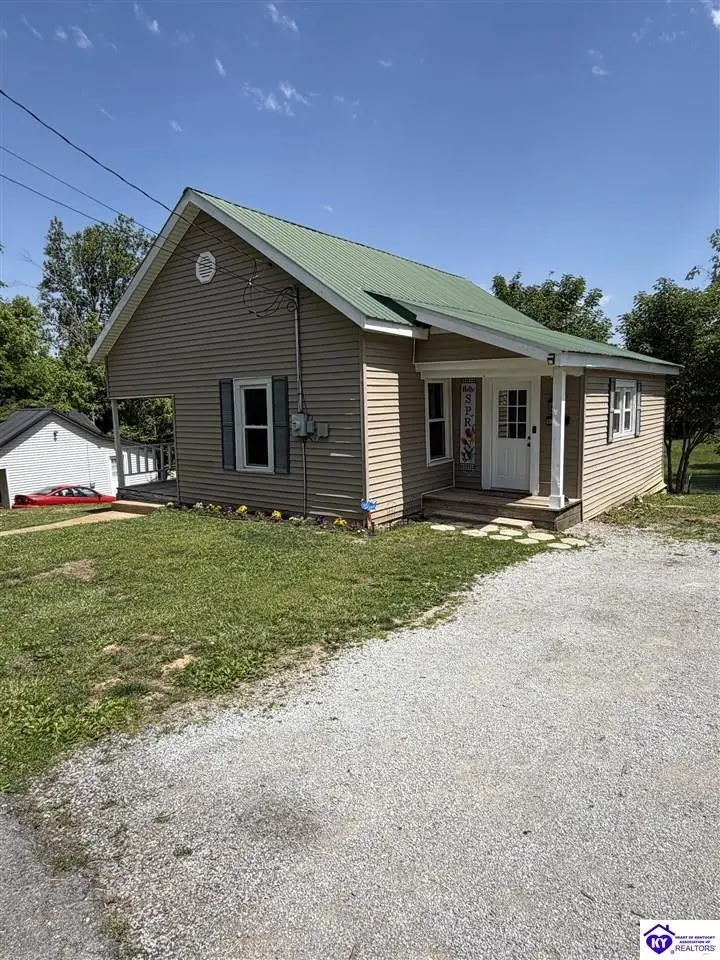
138 Coppock St
Campbellsville, KY 42718
$99,900C
2 bd · 1.0 ba ·
942 sqft ·
Built 1950
· Other
· Pending
· 6 DOM
Cashflow @ list (25.0% down · 7.5%)
Estimated rent
$1,050/mo
Mortgage (P&I)
−$524
Tax + insurance
−$166
HOA
−$0
Vac / Maint / Mgmt
−$220
Net cashflow
$139/mo
Annual
$1,669/yr
Cap rate
7.96%
Cash-on-cash
5.97%
DSCR
1.27
1% rule
1.05%
Cash to close
$27,972
Investor read
- This is a 2-bed/1.0-bath other listed at $100k.
- At list price, monthly cash flow is $139 ($2k/yr) — positive.
- The deal already cash-flows at list — no discount required.
- Meets the 1% rule at list price ($1k rent vs $100k).
- Only 6 days on market — expect competitive offers; lowballing is unlikely to land.
- Local home prices are declining (-3.0%/yr); year-one equity from $691 of loan paydown is wiped out by about $3k of value loss. Plan a longer hold.
- Location reads 76/100 on livability (#94 in KY, #3,786 nationally) — a middle-class / working-renter tenant base. Strengths: cost of living A+, housing A+, health & safety A+; Watch: amenities D+, commute F, employment F.
- Campbellsville Independent (town): math 16% / reading 32% proficiency, ranked #152 of 165 in KY (top 92%) — low school quality limits family demand, transient renter base, plan for 1-2y turnover; 65% free/reduced lunch — lower-income household profile, screen leases tightly.
- Zoned schools: Campbellsville Elementary School (math 16% / reading 27%, grade F, #556 of 676 statewide, top 83%, 638 students, 73% FRL); Campbellsville Middle School (math 15% / reading 37%, grade F, #178 of 217 statewide, top 83%, 311 students, 71% FRL); Campbellsville High School (math 34% / reading 44%, grade F, #40 of 254 statewide, top 19%, 329 students, 63% FRL) — zoned schools at 69% FRL track the district average.
- Watch-outs: built in 1950 — expect roof / HVAC / electrical / plumbing capex.
- Market conditions: 186 active listings in the ZIP; 1 comparable units currently listed for rent nearby; 10 units permitted in Taylor County in 2024 (0 in 5+ unit buildings).
- Taylor County population projected at +13% by 2050 — modest demand growth; plan on rents tracking national, not racing it.
- 2 sale attempts since 3y ago with the ask held roughly flat each time — persistent listings suggest the price (not the market) is what's stuck; bring a comps-based counter.
- Cap rate 8.0% vs local median 3.7% in Campbellsville — top-decile yield for the area; either an underpriced asset or a hidden risk that comps aren't pricing in. Stress-test before assuming the spread holds.
Questions for listing agent
- Built in 1950 — when were the roof, HVAC, electrical panel, plumbing, and water heater last replaced?
- Is there a deadline driving the sale (1031 exchange, divorce, estate, relocation)? That informs how much negotiation room exists.
- What's the average days-on-market for RENTAL listings here right now (not sales)? A rising rental-DOM trend means longer vacancies and softer asking-rent achievability than the comps imply.
- What's the recent tenant-quality profile in this submarket — average credit score on applications, eviction rate, late-payment / NSF rate, and stable-employment percentage? A property-management company in the area should have these aggregated.
- How much new for-sale + rental construction is in the pipeline within 1–3 miles? Heavy new supply typically softens prices + rents 12–24 months out; constrained supply supports both.
CashFlowRE · CFR-MDD7JB73ACT5D0
· Data 2 weeks ago
cashflowre.app · 2026-05-29