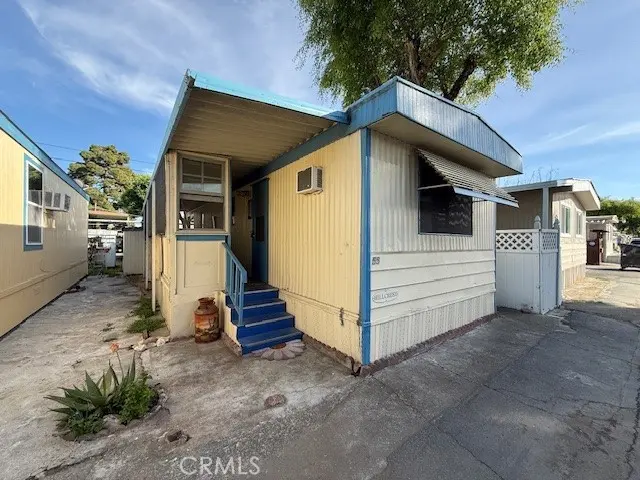
2399 E 14th St #55
San Leandro, CA 94577
$42,000D
1 bd · 1.0 ba ·
480 sqft ·
Built 1976
· Manufactured
· Active
· 59 DOM
Cashflow @ list (25.0% down · 7.5%)
Estimated rent
$1,878/mo
Mortgage (P&I)
−$220
Tax + insurance
−$70
HOA
−$0
Vac / Maint / Mgmt
−$394
Net cashflow
$1,193/mo
Annual
$14,320/yr
Cap rate
40.39%
Cash-on-cash
121.77%
DSCR
6.42
1% rule
4.47%
Cash to close
$11,760
Investor read
- This is a 1-bed/1.0-bath manufactured listed at $42k.
- At list price, monthly cash flow is $1k ($14k/yr) — positive.
- The deal already cash-flows at list — no discount required.
- Meets the 1% rule at list price ($2k rent vs $42k).
- It's been on market 59 days — a 3% lower offer ($41k) is reasonable based on typical stale-listing flexibility.
- Recommended offer: $41k (3.0% below list) — sets the bar for market timing.
- Local home prices are declining (-3.0%/yr); year-one equity from $290 of loan paydown is wiped out by about $1k of value loss. Plan a longer hold.
- Location reads 68/100 on livability (#289 in CA) — a middle-class / working-renter tenant base. Strengths: commute A+, employment A+, health & safety A+; Watch: amenities C-, schools D, crime F.
- San Leandro Unified (urban): math 28% / reading 42% proficiency, ranked #831 of 1,400 in CA (top 59%) — families likely to look elsewhere, expect single-tenant / working-renter base with shorter leases.
- Market conditions: Rents rising (+1.7%/yr); 106 active listings in the ZIP; solid renter incomes; 1,742 units permitted in Alameda County in 2024 (856 in 5+ unit buildings).
- Alameda County population projected at +34% by 2050 — long-run rental-demand tailwind backs the buy-and-hold thesis.
- 6 sale attempts since 11y ago with the ask held roughly flat each time — persistent listings suggest the price (not the market) is what's stuck; bring a comps-based counter.
- Current owner paid $25k; list at $42k implies a 68% gain — meaningful room to come down on a strong offer.
- At projected returns (-3.0% appreciation + 1.7% rent growth), your $12k cash investment doubles in ~1 year — after that, you're playing with house money.
- Cap rate 40.4% vs local median 2.0% in San Leandro — top-decile yield for the area; either an underpriced asset or a hidden risk that comps aren't pricing in. Stress-test before assuming the spread holds.
Questions for listing agent
- It's been on market 59 days. Have you received any prior offers? Is the seller open to a 3% concession, seller financing, or rate buy-down credit?
- Built in 1976 — when were the roof, HVAC, electrical panel, plumbing, and water heater last replaced?
- Is there a deadline driving the sale (1031 exchange, divorce, estate, relocation)? That informs how much negotiation room exists.
- Schools are D-rated, which usually means shorter tenancies and higher turnover. Who's the typical renter profile here, and what's been the actual vacancy rate?
- Crime grade is F in this area — have there been break-ins, vandalism, or insurance claims at this property in the last 3 years? What carrier currently insures it and at what premium?
- The area grade is low — what's the realistic commute time and amenity access for the typical tenant pool here? Any planned neighborhood developments (good or bad) we should know about?
- What's the average days-on-market for RENTAL listings here right now (not sales)? A rising rental-DOM trend means longer vacancies and softer asking-rent achievability than the comps imply.
- What's the recent tenant-quality profile in this submarket — average credit score on applications, eviction rate, late-payment / NSF rate, and stable-employment percentage? A property-management company in the area should have these aggregated.
CashFlowRE · CFR-MEHF87ANN2BST3
· Data 2 days ago
cashflowre.app · 2026-05-29