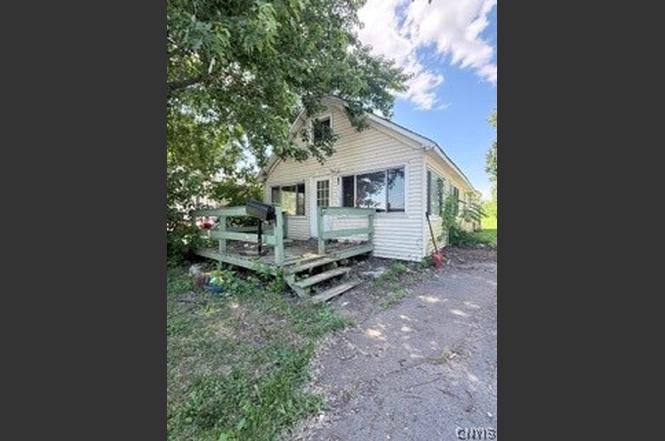
39 Woodworth Rd
Brewerton, NY 13036
$105,000B+
2 bd · 1.0 ba ·
1,008 sqft ·
Built 1945
· SingleFamily
· Active
· 4 DOM
Cashflow @ list (25.0% down · 7.5%)
Estimated rent
$1,877/mo
Mortgage (P&I)
−$551
Tax + insurance
−$302
HOA
−$0
Vac / Maint / Mgmt
−$394
Net cashflow
$630/mo
Annual
$7,563/yr
Cap rate
13.50%
Cash-on-cash
25.72%
DSCR
2.14
1% rule
1.79%
Cash to close
$29,400
Investor read
- This is a 2-bed/1.0-bath single-family listed at $105k.
- At list price, monthly cash flow is $630 ($8k/yr) — positive.
- The deal already cash-flows at list — no discount required.
- Meets the 1% rule at list price ($2k rent vs $105k).
- Only 4 days on market — expect competitive offers; lowballing is unlikely to land.
- In year one you build about $11k of equity ($726 loan paydown + $10k appreciation (10.0% local appreciation)).
- Location reads 66/100 on livability (#618 in NY) — a middle-class / working-renter tenant base. Strengths: housing A+, employment A, cost of living B+; Watch: amenities F, commute F, health & safety D-.
- Central Square Central School District (suburban): math 40% / reading 40% proficiency, ranked #507 of 590 in NY (top 86%) — families likely to look elsewhere, expect single-tenant / working-renter base with shorter leases.
- Zoned schools: Millard Hawk Elementary School (math 22% / reading 32%, grade F, #1,786 of 2,108 statewide, top 86%, 477 students, 52% FRL); Central Square Middle School (math 19% / reading 35%, grade F, #587 of 729 statewide, top 81%, 833 students, 45% FRL); Paul V Moore High School (math 91% / reading 75%, grade A, #440 of 1,100 statewide, top 40%, 1,101 students, 44% FRL).
- Watch-outs: property tax is 3.0% of price; built in 1945 — expect roof / HVAC / electrical / plumbing capex.
- Market conditions: 36 active listings in the ZIP; 172 units permitted in Oswego County in 2024 (27 in 5+ unit buildings).
- Oswego County population projected at -23% by 2050 — secular population decline; favor cash flow + early exit over multi-decade hold.
- Current owner paid $55k; list at $105k implies a 91% gain — meaningful room to come down on a strong offer.
- At projected returns (10.0% appreciation + 3.0% rent growth), your $29k cash investment doubles in ~2 years — after that, you're playing with house money.
- By year 4, paydown + projected appreciation supports a ~$40k cash-out refi (75% LTV) — recoverable capital for the next deal without selling this one.
- Cap rate 13.5% vs local median 3.5% in Brewerton — top-decile yield for the area; either an underpriced asset or a hidden risk that comps aren't pricing in. Stress-test before assuming the spread holds.
Questions for listing agent
- Built in 1945 — when were the roof, HVAC, electrical panel, plumbing, and water heater last replaced?
- Property tax is high relative to price — has the assessment been appealed recently, and will the sale trigger a re-assessment?
- Is there a deadline driving the sale (1031 exchange, divorce, estate, relocation)? That informs how much negotiation room exists.
- What's the average days-on-market for RENTAL listings here right now (not sales)? A rising rental-DOM trend means longer vacancies and softer asking-rent achievability than the comps imply.
- What's the recent tenant-quality profile in this submarket — average credit score on applications, eviction rate, late-payment / NSF rate, and stable-employment percentage? A property-management company in the area should have these aggregated.
- How much new for-sale + rental construction is in the pipeline within 1–3 miles? Heavy new supply typically softens prices + rents 12–24 months out; constrained supply supports both.
CashFlowRE · CFR-MFNWQY0YPH7FWP
· Data 5 h ago
cashflowre.app · 2026-05-29