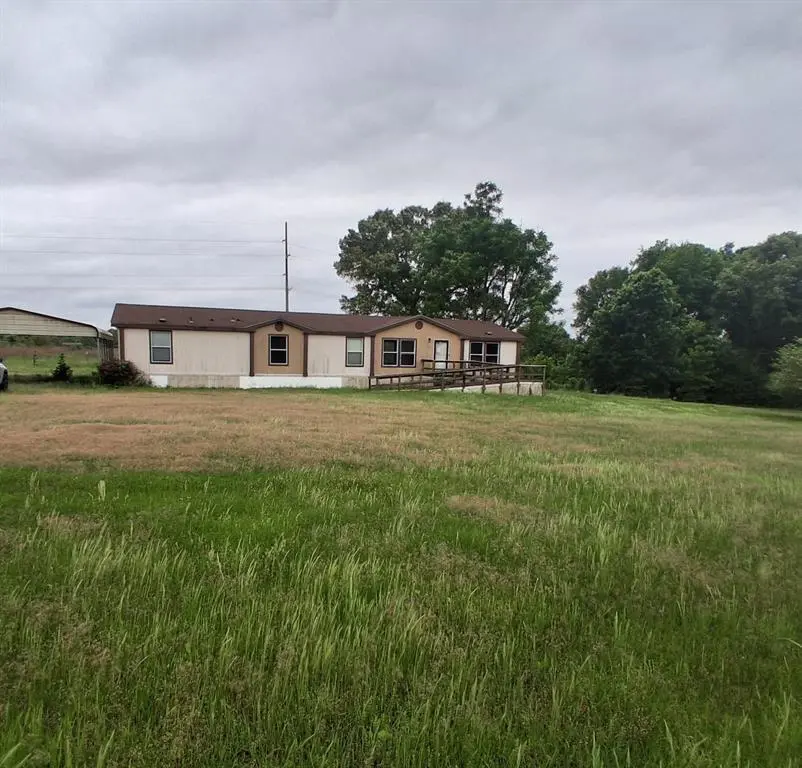
105 Spring Creek Pl
Texarkana, TX 75501
$136,000C-
4 bd · 3.0 ba ·
2,052 sqft ·
Built 2006
· Manufactured
· Active
· 27 DOM
Cashflow @ list (25.0% down · 7.5%)
Estimated rent
$1,432/mo
Mortgage (P&I)
−$713
Tax + insurance
−$212
HOA
−$0
Vac / Maint / Mgmt
−$301
Net cashflow
$207/mo
Annual
$2,483/yr
Cap rate
8.12%
Cash-on-cash
6.52%
DSCR
1.29
1% rule
1.05%
Cash to close
$38,080
Investor read
- This is a 4-bed/3.0-bath manufactured listed at $136k.
- At list price, monthly cash flow is $207 ($2k/yr) — positive.
- The deal already cash-flows at list — no discount required.
- Meets the 1% rule at list price ($1k rent vs $136k).
- It's been on market 27 days — a 2% lower offer ($134k) is reasonable based on typical stale-listing flexibility.
- Recommended offer: $134k (1.5% below list) — sets the bar for market timing.
- Local home prices are declining (-3.0%/yr); year-one equity from $940 of loan paydown is wiped out by about $4k of value loss. Plan a longer hold.
- Location reads 77/100 on livability (#93 in TX, #3,241 nationally) — a middle-class / working-renter tenant base. Strengths: cost of living A+, housing A+, health & safety A+; Watch: amenities D+, crime D, employment D.
- Liberty-Eylau ISD (urban): math 19% / reading 23% proficiency, ranked #772 of 826 in TX (top 94%) — low school quality limits family demand, transient renter base, plan for 1-2y turnover; 68% free/reduced lunch — lower-income household profile, screen leases tightly.
- Zoned schools: Liberty-Eylau El (math 20% / reading 16%, grade F, #3,785 of 4,322 statewide, top 88%, 575 students, 90% FRL) — zoned schools average 90% FRL vs 68% district-wide (23 pts higher); higher-poverty schools than district average — tighter screening recommended.
- Market conditions: Rents rising (+1.6%/yr); 320 active listings in the ZIP; 137 units permitted in Bowie County in 2024 (5 in 5+ unit buildings).
- Climate carrying-cost: major wind risk, 27% chance of damaging wind over 30y; major wildfire risk; extreme-heat days projected 7→24/yr by 2055 (HVAC capex compounding) — expect insurance premiums to compound above CPI over the hold.
- Cap rate 8.1% vs local median 4.3% in Texarkana — top-decile yield for the area; either an underpriced asset or a hidden risk that comps aren't pricing in. Stress-test before assuming the spread holds.
- This rent runs 37% of the median local income ($46k/yr) — at the standard rent-burdened threshold; future hikes will face affordability resistance.
Questions for listing agent
- Is there a deadline driving the sale (1031 exchange, divorce, estate, relocation)? That informs how much negotiation room exists.
- Schools are D-rated, which usually means shorter tenancies and higher turnover. Who's the typical renter profile here, and what's been the actual vacancy rate?
- Crime grade is D in this area — have there been break-ins, vandalism, or insurance claims at this property in the last 3 years? What carrier currently insures it and at what premium?
- What's the average days-on-market for RENTAL listings here right now (not sales)? A rising rental-DOM trend means longer vacancies and softer asking-rent achievability than the comps imply.
- What's the recent tenant-quality profile in this submarket — average credit score on applications, eviction rate, late-payment / NSF rate, and stable-employment percentage? A property-management company in the area should have these aggregated.
- How much new for-sale + rental construction is in the pipeline within 1–3 miles? Heavy new supply typically softens prices + rents 12–24 months out; constrained supply supports both.
CashFlowRE · CFR-MFP65CB27PZAC0
· Data 1 day ago
cashflowre.app · 2026-05-29