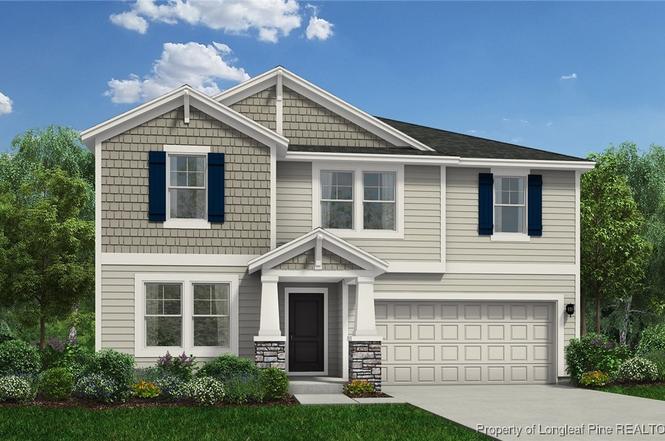
145 Hornet (lot 69) Dr
Rockfish, NC 28376
$318,293D-
4 bd · 3.0 ba ·
2,433 sqft ·
Built 2024
· Other
· Pending
· 1 DOM
Cashflow @ list (25.0% down · 7.5%)
Estimated rent
$2,451/mo
Mortgage (P&I)
−$1,669
Tax + insurance
−$319
HOA
−$33
Vac / Maint / Mgmt
−$515
Net cashflow
$-85/mo
Annual
$-1,018/yr
Cap rate
5.97%
Cash-on-cash
-1.14%
DSCR
0.95
1% rule
0.77%
Cash to close
$89,122
Investor read
- This is a 4-bed/3.0-bath other listed at $318k.
- At list price, monthly cash flow is $-85 ($-1k/yr) — negative.
- To cash-flow at today's rent, offer at most $303k (4.7% below list).
- To meet the 1% rule (rent ≥ 1% of price), the offer needs to be $245k (23.0% below list).
- Only 1 days on market — expect competitive offers; lowballing is unlikely to land.
- Recommended offer: $245k (23.0% below list) — sets the bar for 1% rule.
- Local home prices are declining (-3.0%/yr); year-one equity from $2k of loan paydown is wiped out by about $10k of value loss. Plan a longer hold.
- Location reads 71/100 on livability (#108 in NC) — a middle-class / working-renter tenant base. Strengths: cost of living A+, housing A+, crime A; Watch: amenities F, commute F.
- Hoke County Schools (suburban): math 35% / reading 40% proficiency, ranked #123 of 178 in NC (top 69%) — families likely to look elsewhere, expect single-tenant / working-renter base with shorter leases.
- Zoned schools: Hoke County High (math 42% / reading 44%, grade F, #372 of 535 statewide, top 69%, 2,060 students, 100% FRL) — zoned schools average 100% FRL vs 57% district-wide (43 pts higher); higher-poverty schools than district average — tighter screening recommended.
- Market conditions: Rents rising (+1.9%/yr); 566 active listings in the ZIP; 5 comparable units currently listed for rent nearby; rentals at typical pace (median 24d on market — plan ~3-4 weeks tenant-placement turnaround); 685 units permitted in Hoke County in 2024 (0 in 5+ unit buildings).
- Hoke County population projected at +36% by 2050 — long-run rental-demand tailwind backs the buy-and-hold thesis.
- Cap rate 6.0% vs local median 4.7% in Rockfish — meaningfully above typical; check what's discounted (condition, days-on-market, listing class) to confirm the premium yield is real.
- This rent runs 44% of the median local income ($66k/yr) — at the standard rent-burdened threshold; future hikes will face affordability resistance.
Questions for listing agent
- What do current leases actually rent for vs. the listed asking? Can we see a recent rent roll and the last 12 months of T-12 income?
- What does the HOA fee cover, when was the last increase, and are there any pending special assessments or reserve-fund shortfalls?
- Is there a deadline driving the sale (1031 exchange, divorce, estate, relocation)? That informs how much negotiation room exists.
- Schools are A-rated — typically a magnet for longer-tenancy family renters. What's the average tenant stay here, and is there a school-zone premium baked into asking?
- The area grade is low — what's the realistic commute time and amenity access for the typical tenant pool here? Any planned neighborhood developments (good or bad) we should know about?
- What's the average days-on-market for RENTAL listings here right now (not sales)? A rising rental-DOM trend means longer vacancies and softer asking-rent achievability than the comps imply.
- What's the recent tenant-quality profile in this submarket — average credit score on applications, eviction rate, late-payment / NSF rate, and stable-employment percentage? A property-management company in the area should have these aggregated.
- How much new for-sale + rental construction is in the pipeline within 1–3 miles? Heavy new supply typically softens prices + rents 12–24 months out; constrained supply supports both.
CashFlowRE · CFR-MP4Q46E8N1DA5Y
· Data 6 days ago
cashflowre.app · 2026-05-29