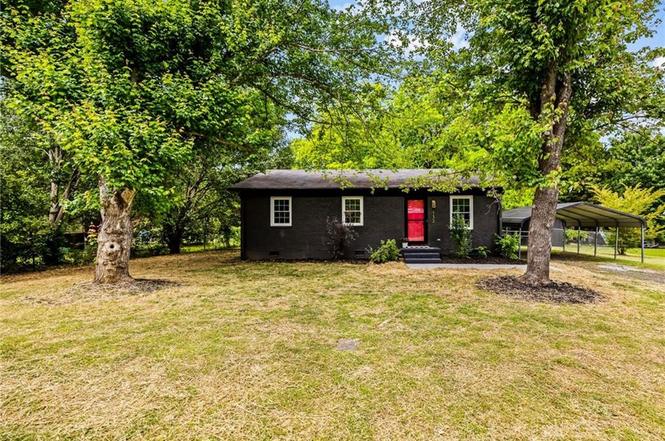
132 Kime Ave
Liberty, NC 27298
$218,000F
3 bd · 1.0 ba ·
999 sqft ·
Built 1984
· SingleFamily
· Active
· 143 DOM
Cashflow @ list (25.0% down · 7.5%)
Estimated rent
$1,650/mo
Mortgage (P&I)
−$1,143
Tax + insurance
−$222
HOA
−$0
Vac / Maint / Mgmt
−$346
Net cashflow
$-62/mo
Annual
$-739/yr
Cap rate
5.95%
Cash-on-cash
-1.21%
DSCR
0.95
1% rule
0.76%
Cash to close
$61,040
Investor read
- This is a 3-bed/1.0-bath single-family listed at $218k.
- At list price, monthly cash flow is $-62 ($-739/yr) — negative.
- To cash-flow at today's rent, offer at most $207k (5.0% below list).
- To meet the 1% rule (rent ≥ 1% of price), the offer needs to be $165k (24.3% below list).
- It's been on market 143 days — a 12% lower offer ($192k) is reasonable based on typical stale-listing flexibility.
- Recommended offer: $165k (24.3% below list) — sets the bar for 1% rule.
- Local home prices are declining (-3.0%/yr); year-one equity from $2k of loan paydown is wiped out by about $7k of value loss. Plan a longer hold.
- Location reads 74/100 on livability (#56 in NC, #4,472 nationally) — a middle-class / working-renter tenant base. Strengths: cost of living A+, housing A+, health & safety A+; Watch: schools F, amenities F, commute F.
- Randolph County School System (rural): math 43% / reading 43% proficiency, ranked #94 of 178 in NC (top 53%) — families likely to look elsewhere, expect single-tenant / working-renter base with shorter leases.
- Market conditions: 79 active listings in the ZIP; 1 comparable units currently listed for rent nearby; 789 units permitted in Randolph County in 2024 (168 in 5+ unit buildings).
- Randolph County population projected to shrink 10% by 2050 — rents likely to lag national; underwrite the cash flow, not the appreciation.
- 2 sale attempts since 2y ago; this cycle's ask has dropped $24k (10%) from the opening price — seller is motivated, your offer sets the floor, not the list.
- Climate carrying-cost: moderate wind risk, 25% chance of damaging wind over 30y; extreme-heat days projected 7→17/yr by 2055 (HVAC capex compounding) — expect insurance premiums to compound above CPI over the hold.
- Cap rate 6.0% vs local median 4.3% in Liberty — top-decile yield for the area; either an underpriced asset or a hidden risk that comps aren't pricing in. Stress-test before assuming the spread holds.
Questions for listing agent
- What do current leases actually rent for vs. the listed asking? Can we see a recent rent roll and the last 12 months of T-12 income?
- It's been on market 143 days. Have you received any prior offers? Is the seller open to a 24% concession, seller financing, or rate buy-down credit?
- Why hasn't it sold? Are there any deal-killer items the seller is aware of (foundation, flood, title, zoning, code violations)?
- Is there a deadline driving the sale (1031 exchange, divorce, estate, relocation)? That informs how much negotiation room exists.
- Schools are F-rated, which usually means shorter tenancies and higher turnover. Who's the typical renter profile here, and what's been the actual vacancy rate?
- The area grade is low — what's the realistic commute time and amenity access for the typical tenant pool here? Any planned neighborhood developments (good or bad) we should know about?
- What's the average days-on-market for RENTAL listings here right now (not sales)? A rising rental-DOM trend means longer vacancies and softer asking-rent achievability than the comps imply.
- What's the recent tenant-quality profile in this submarket — average credit score on applications, eviction rate, late-payment / NSF rate, and stable-employment percentage? A property-management company in the area should have these aggregated.
CashFlowRE · CFR-MPJ7WZ3Z68ME9V
· Data 2 weeks ago
cashflowre.app · 2026-05-29