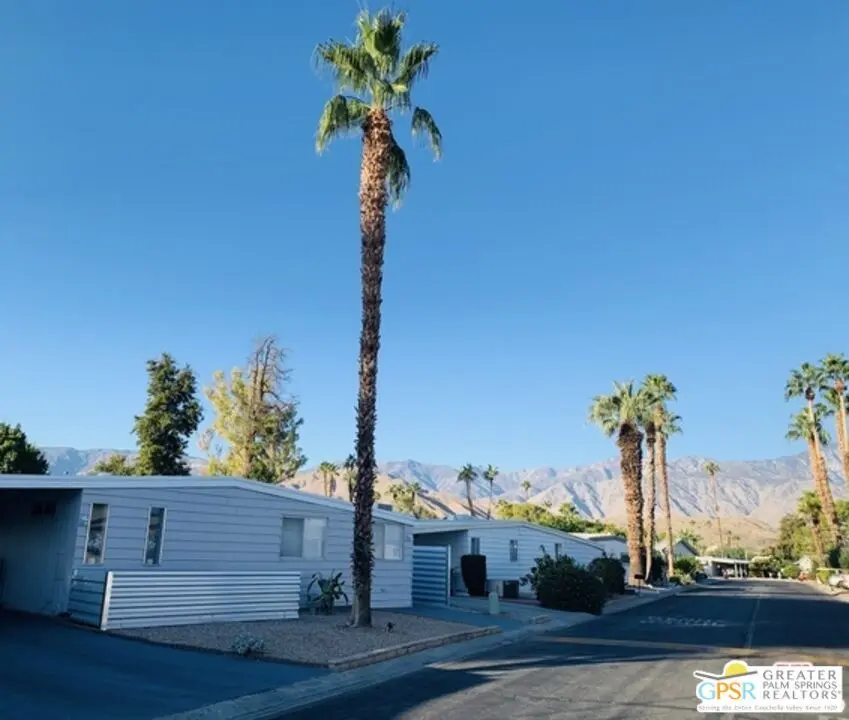
112 Via Valverde
Cathedral City, CA 92234
$149,900C+
2 bd · 2.0 ba ·
1,888 sqft ·
Built 1972
· Manufactured
· Active
· 17 DOM
Cashflow @ list (25.0% down · 7.5%)
Estimated rent
$3,098/mo
Mortgage (P&I)
−$786
Tax + insurance
−$250
HOA
−$0
Vac / Maint / Mgmt
−$651
Net cashflow
$1,411/mo
Annual
$16,935/yr
Cap rate
17.59%
Cash-on-cash
40.35%
DSCR
2.80
1% rule
2.07%
Cash to close
$41,972
Investor read
- This is a 2-bed/2.0-bath manufactured listed at $150k.
- At list price, monthly cash flow is $1k ($17k/yr) — positive.
- The deal already cash-flows at list — no discount required.
- Meets the 1% rule at list price ($3k rent vs $150k).
- It's been on market 17 days — a 2% lower offer ($148k) is reasonable based on typical stale-listing flexibility.
- Recommended offer: $148k (1.5% below list) — sets the bar for market timing.
- Local home prices are declining (-3.0%/yr); year-one equity from $1k of loan paydown is wiped out by about $4k of value loss. Plan a longer hold.
- Location reads 66/100 on livability (#344 in CA) — a middle-class / working-renter tenant base. Strengths: commute A+, housing B+; Watch: employment D+, schools F, amenities D-.
- Palm Springs Unified (suburban): math 21% / reading 42% proficiency, ranked #328 of 517 in CA (top 63%) — families likely to look elsewhere, expect single-tenant / working-renter base with shorter leases; 73% free/reduced lunch — lower-income household profile, screen leases tightly.
- Market conditions: Rents rising (+3.2%/yr); 525 active listings in the ZIP; 40 comparable units currently listed for rent nearby; rentals lingering (median 44d on market — plan ~5-8 weeks vacancy on turnover, expect pricing pressure); 52% of comp listings sitting > 30 days — soft ceiling on asking rent; 9,195 units permitted in Riverside County in 2024 (1,512 in 5+ unit buildings).
- Riverside County population projected at +22% by 2050 — long-run rental-demand tailwind backs the buy-and-hold thesis.
- 6 sale attempts since 18y ago; this cycle's ask has dropped $53k (26%) from the opening price — seller is motivated, your offer sets the floor, not the list.
- Current owner paid $8k; list at $150k implies a 1774% gain — meaningful room to come down on a strong offer.
- At projected returns (-3.0% appreciation + 3.2% rent growth), your $42k cash investment doubles in ~3 years — after that, you're playing with house money.
- Climate carrying-cost: extreme-heat days projected 7→20/yr by 2055 (HVAC capex compounding) — expect insurance premiums to compound above CPI over the hold.
- Cap rate 17.6% vs local median 5.1% in Cathedral City — top-decile yield for the area; either an underpriced asset or a hidden risk that comps aren't pricing in. Stress-test before assuming the spread holds.
- At $3,098/mo this rent would consume 51% of the median local household income ($74k/yr) (locally 1682% of renters already pay >50% of income on rent) — very limited rent-growth headroom before tenants either downsize or default.
Questions for listing agent
- Built in 1972 — when were the roof, HVAC, electrical panel, plumbing, and water heater last replaced?
- Is there a deadline driving the sale (1031 exchange, divorce, estate, relocation)? That informs how much negotiation room exists.
- Schools are F-rated, which usually means shorter tenancies and higher turnover. Who's the typical renter profile here, and what's been the actual vacancy rate?
- What's the average days-on-market for RENTAL listings here right now (not sales)? A rising rental-DOM trend means longer vacancies and softer asking-rent achievability than the comps imply.
- What's the recent tenant-quality profile in this submarket — average credit score on applications, eviction rate, late-payment / NSF rate, and stable-employment percentage? A property-management company in the area should have these aggregated.
- How much new for-sale + rental construction is in the pipeline within 1–3 miles? Heavy new supply typically softens prices + rents 12–24 months out; constrained supply supports both.
CashFlowRE · CFR-MQW1G7CC7BQPRV
· Data 2 days ago
cashflowre.app · 2026-05-29