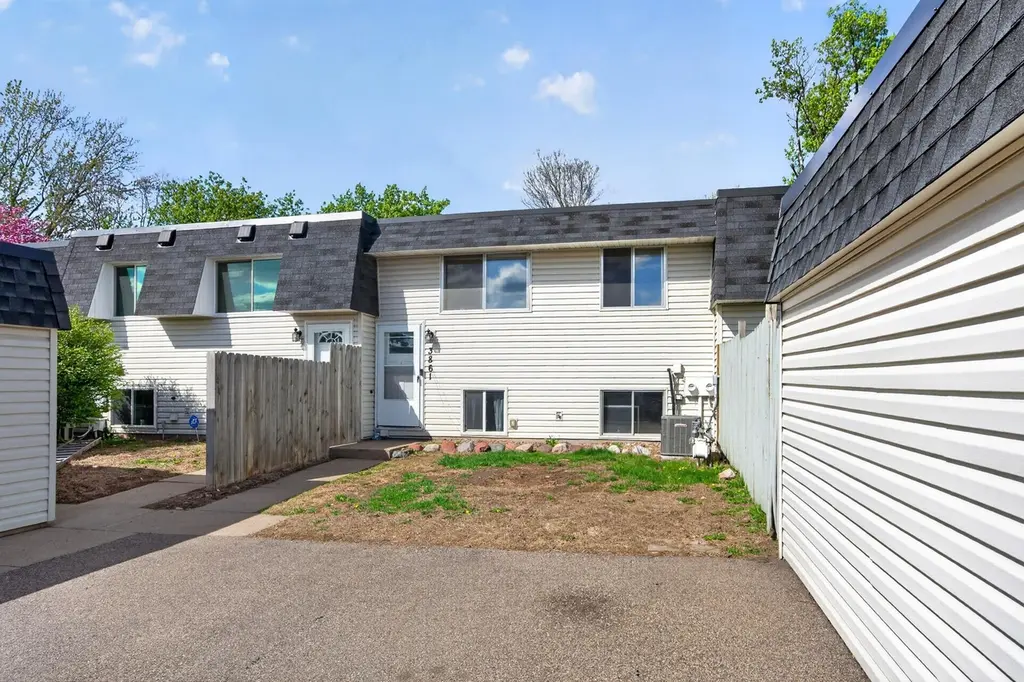
3861 Conroy Trl
Inver Grove Heights, MN 55076
$210,000D
4 bd · 2.0 ba ·
1,604 sqft ·
Built 1972
· Townhouse
· Pending
· 3 DOM
Cashflow @ list (25.0% down · 7.5%)
Estimated rent
$2,245/mo
Mortgage (P&I)
−$1,101
Tax + insurance
−$265
HOA
−$390
Vac / Maint / Mgmt
−$471
Net cashflow
$18/mo
Annual
$211/yr
Cap rate
6.39%
Cash-on-cash
0.36%
DSCR
1.02
1% rule
1.07%
Cash to close
$58,800
Investor read
- This is a 4-bed/2.0-bath townhouse listed at $210k.
- At list price, monthly cash flow is $18 ($211/yr) — positive.
- The deal already cash-flows at list — no discount required.
- Meets the 1% rule at list price ($2k rent vs $210k).
- Only 3 days on market — expect competitive offers; lowballing is unlikely to land.
- Local home prices are declining (-3.0%/yr); year-one equity from $1k of loan paydown is wiped out by about $6k of value loss. Plan a longer hold.
- Location reads 76/100 on livability (#146 in MN, #3,277 nationally) — a middle-class / working-renter tenant base. Strengths: commute A+, employment A+, housing A+; Watch: amenities F, health & safety F.
- Inver Grove Heights Schools (suburban): math 32% / reading 41% proficiency, ranked #234 of 301 in MN (top 78%) — families likely to look elsewhere, expect single-tenant / working-renter base with shorter leases.
- Zoned schools: Hilltop Elementary (math 22% / reading 32%, grade F, #703 of 857 statewide, top 84%, 574 students, 62% FRL); Inver Grove Heights Middle (math 25% / reading 36%, grade F, #192 of 258 statewide, top 77%, 761 students, 59% FRL); Simley Senior High (math 27% / reading 52%, grade F, #246 of 471 statewide, top 59%, 1,062 students, 49% FRL) — zoned schools average 57% FRL vs 31% district-wide (26 pts higher); higher-poverty schools than district average — tighter screening recommended.
- Market conditions: 105 active listings in the ZIP; 4 comparable units currently listed for rent nearby; rentals at typical pace (median 18d on market — plan ~3-4 weeks tenant-placement turnaround); 2,134 units permitted in Dakota County in 2024 (898 in 5+ unit buildings).
- Dakota County population projected at +11% by 2050 — modest demand growth; plan on rents tracking national, not racing it.
- 9 sale attempts since 23y ago with the ask held roughly flat each time — persistent listings suggest the price (not the market) is what's stuck; bring a comps-based counter.
- Cap rate 6.4% vs local median 3.2% in Inver Grove Heights — top-decile yield for the area; either an underpriced asset or a hidden risk that comps aren't pricing in. Stress-test before assuming the spread holds.
Questions for listing agent
- Built in 1972 — when were the roof, HVAC, electrical panel, plumbing, and water heater last replaced?
- What does the HOA fee cover, when was the last increase, and are there any pending special assessments or reserve-fund shortfalls?
- Is there a deadline driving the sale (1031 exchange, divorce, estate, relocation)? That informs how much negotiation room exists.
- The area grade is low — what's the realistic commute time and amenity access for the typical tenant pool here? Any planned neighborhood developments (good or bad) we should know about?
- What's the average days-on-market for RENTAL listings here right now (not sales)? A rising rental-DOM trend means longer vacancies and softer asking-rent achievability than the comps imply.
- What's the recent tenant-quality profile in this submarket — average credit score on applications, eviction rate, late-payment / NSF rate, and stable-employment percentage? A property-management company in the area should have these aggregated.
- How much new for-sale + rental construction is in the pipeline within 1–3 miles? Heavy new supply typically softens prices + rents 12–24 months out; constrained supply supports both.
CashFlowRE · CFR-MT5GS631SSM6K0
· Data 4 weeks ago
cashflowre.app · 2026-05-29