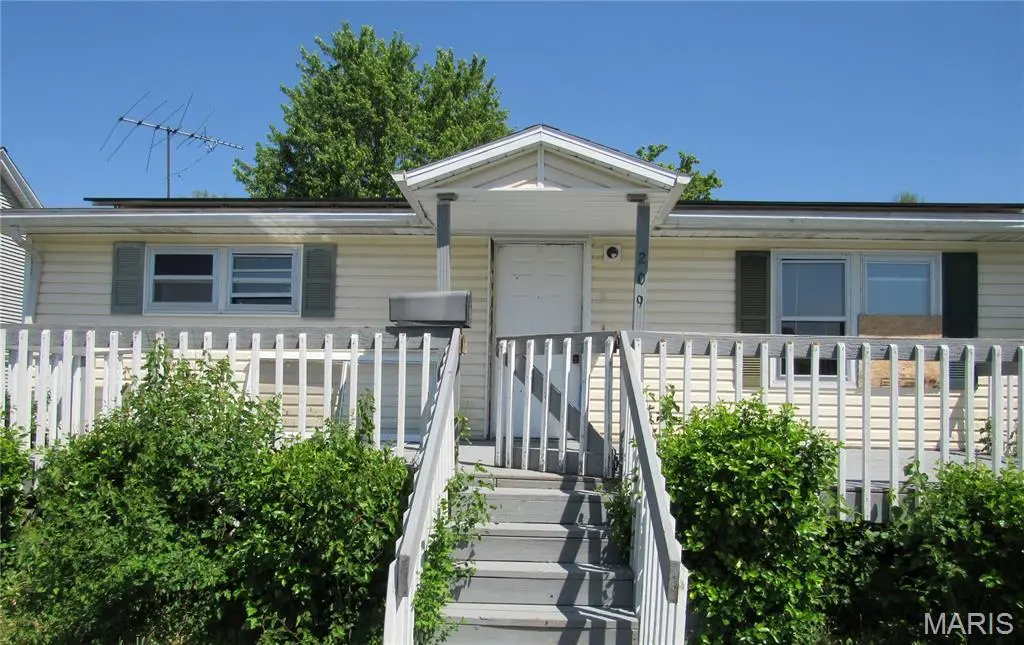
209 W 2nd South St
Mount Olive, IL 62069
$49,950A-
2 bd · 1.0 ba ·
912 sqft ·
Built 1980
· SingleFamily
· Active
· 45 DOM
Cashflow @ list (25.0% down · 7.5%)
Estimated rent
$875/mo
Mortgage (P&I)
−$262
Tax + insurance
−$86
HOA
−$0
Vac / Maint / Mgmt
−$184
Net cashflow
$344/mo
Annual
$4,123/yr
Cap rate
14.55%
Cash-on-cash
29.48%
DSCR
2.31
1% rule
1.75%
Cash to close
$13,986
Investor read
- This is a 2-bed/1.0-bath single-family listed at $50k.
- At list price, monthly cash flow is $344 ($4k/yr) — positive.
- The deal already cash-flows at list — no discount required.
- Meets the 1% rule at list price ($875 rent vs $50k).
- It's been on market 45 days — a 3% lower offer ($48k) is reasonable based on typical stale-listing flexibility.
- Recommended offer: $48k (3.0% below list) — sets the bar for market timing.
- In year one you build about $5k of equity ($346 loan paydown + $5k appreciation (10.0% local appreciation)).
- Location reads 61/100 on livability (#937 in IL) — a middle-class / working-renter tenant base. Strengths: cost of living A+, housing A+, crime A; Watch: employment D+, amenities F, commute F.
- Mount Olive CUSD 5 (rural): math 16% / reading 17% proficiency, ranked #483 of 620 in IL (top 78%) — low school quality limits family demand, transient renter base, plan for 1-2y turnover.
- Zoned schools: Mt Olive High School (math 24% / reading 34%, grade F, #187 of 693 statewide, top 30%, 126 students, 0% FRL) — zoned schools average 0% FRL vs 39% district-wide (39 pts lower); this property's tenant base skews higher-income than the district average.
- Zoned-school proficiency averages 30% at this address vs 16% district-wide (+13 pts) — the actual schools serving this property are materially stronger than the Mount Olive CUSD 5 average implies; a family-tenant draw the district grade alone would hide.
- Market conditions: 20 active listings in the ZIP; 70 units permitted in Macoupin County in 2024 (0 in 5+ unit buildings).
- Macoupin County population projected at -27% by 2050 — secular population decline; favor cash flow + early exit over multi-decade hold.
- Current owner paid $22k; list at $50k implies a 127% gain — meaningful room to come down on a strong offer.
- At projected returns (10.0% appreciation + 3.0% rent growth), your $14k cash investment doubles in ~2 years — after that, you're playing with house money.
- By year 6, paydown + projected appreciation supports a ~$31k cash-out refi (75% LTV) — recoverable capital for the next deal without selling this one.
Questions for listing agent
- It's been on market 45 days. Have you received any prior offers? Is the seller open to a 3% concession, seller financing, or rate buy-down credit?
- Is there a deadline driving the sale (1031 exchange, divorce, estate, relocation)? That informs how much negotiation room exists.
- Schools are F-rated, which usually means shorter tenancies and higher turnover. Who's the typical renter profile here, and what's been the actual vacancy rate?
- What's the average days-on-market for RENTAL listings here right now (not sales)? A rising rental-DOM trend means longer vacancies and softer asking-rent achievability than the comps imply.
- What's the recent tenant-quality profile in this submarket — average credit score on applications, eviction rate, late-payment / NSF rate, and stable-employment percentage? A property-management company in the area should have these aggregated.
- How much new for-sale + rental construction is in the pipeline within 1–3 miles? Heavy new supply typically softens prices + rents 12–24 months out; constrained supply supports both.
CashFlowRE · CFR-MVMKDX6PTGS7W6
· Data 2 days ago
cashflowre.app · 2026-05-29