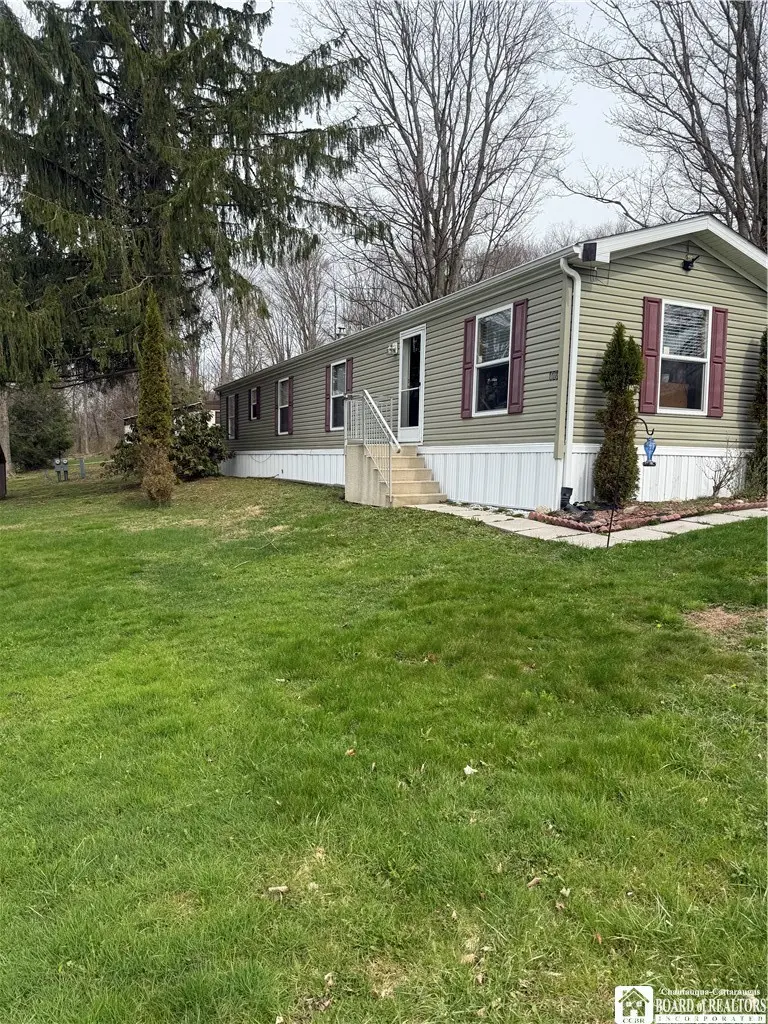
108 Circle Greenhurst Village Dr
Lakewood, NY 14701
$39,900B
2 bd · 1.0 ba ·
728 sqft ·
Built 2015
· Manufactured
· Active
· 62 DOM
Cashflow @ list (25.0% down · 7.5%)
Estimated rent
$960/mo
Mortgage (P&I)
−$209
Tax + insurance
−$81
HOA
−$0
Vac / Maint / Mgmt
−$202
Net cashflow
$469/mo
Annual
$5,624/yr
Cap rate
20.39%
Cash-on-cash
50.34%
DSCR
3.24
1% rule
2.41%
Cash to close
$11,172
Investor read
- This is a 2-bed/1.0-bath manufactured listed at $40k.
- At list price, monthly cash flow is $469 ($6k/yr) — positive.
- The deal already cash-flows at list — no discount required.
- Meets the 1% rule at list price ($960 rent vs $40k).
- It's been on market 62 days — a 6% lower offer ($38k) is reasonable based on typical stale-listing flexibility.
- Recommended offer: $38k (6.0% below list) — sets the bar for market timing.
- Local home prices are declining (-3.0%/yr); year-one equity from $276 of loan paydown is wiped out by about $1k of value loss. Plan a longer hold.
- Location reads 71/100 on livability (#398 in NY) — a middle-class / working-renter tenant base. Strengths: cost of living A+, housing A+, health & safety A+; Watch: employment D+, amenities F, commute F.
- Bemus Point Central School District (rural): math 65% / reading 61% proficiency, ranked #238 of 755 in NY (top 32%) — acceptable for families but not a draw, mixed tenant base, ~2y average lease; only 18% free/reduced lunch — higher-income household profile.
- Zoned schools: Bemus Point Elementary School (math 57% / reading 57%, grade C+, #842 of 2,108 statewide, top 43%, 283 students, 35% FRL); Maple Grove Junior/Senior High School (math 57% / reading 52%, grade C-, #912 of 1,100 statewide, top 85%, 319 students, 30% FRL).
- Market conditions: 315 active listings in the ZIP; 127 units permitted in Chautauqua County in 2024 (0 in 5+ unit buildings).
- Chautauqua County population projected at -22% by 2050 — secular population decline; favor cash flow + early exit over multi-decade hold.
- At projected returns (-3.0% appreciation + 3.0% rent growth), your $11k cash investment doubles in ~3 years — after that, you're playing with house money.
- Cap rate 20.4% vs local median 3.0% in Lakewood — top-decile yield for the area; either an underpriced asset or a hidden risk that comps aren't pricing in. Stress-test before assuming the spread holds.
Questions for listing agent
- It's been on market 62 days. Have you received any prior offers? Is the seller open to a 6% concession, seller financing, or rate buy-down credit?
- Why hasn't it sold? Are there any deal-killer items the seller is aware of (foundation, flood, title, zoning, code violations)?
- Is there a deadline driving the sale (1031 exchange, divorce, estate, relocation)? That informs how much negotiation room exists.
- Schools are D-rated, which usually means shorter tenancies and higher turnover. Who's the typical renter profile here, and what's been the actual vacancy rate?
- What's the average days-on-market for RENTAL listings here right now (not sales)? A rising rental-DOM trend means longer vacancies and softer asking-rent achievability than the comps imply.
- What's the recent tenant-quality profile in this submarket — average credit score on applications, eviction rate, late-payment / NSF rate, and stable-employment percentage? A property-management company in the area should have these aggregated.
- How much new for-sale + rental construction is in the pipeline within 1–3 miles? Heavy new supply typically softens prices + rents 12–24 months out; constrained supply supports both.
CashFlowRE · CFR-MXCNC8CQXRZKZB
· Data 20 h ago
cashflowre.app · 2026-05-29