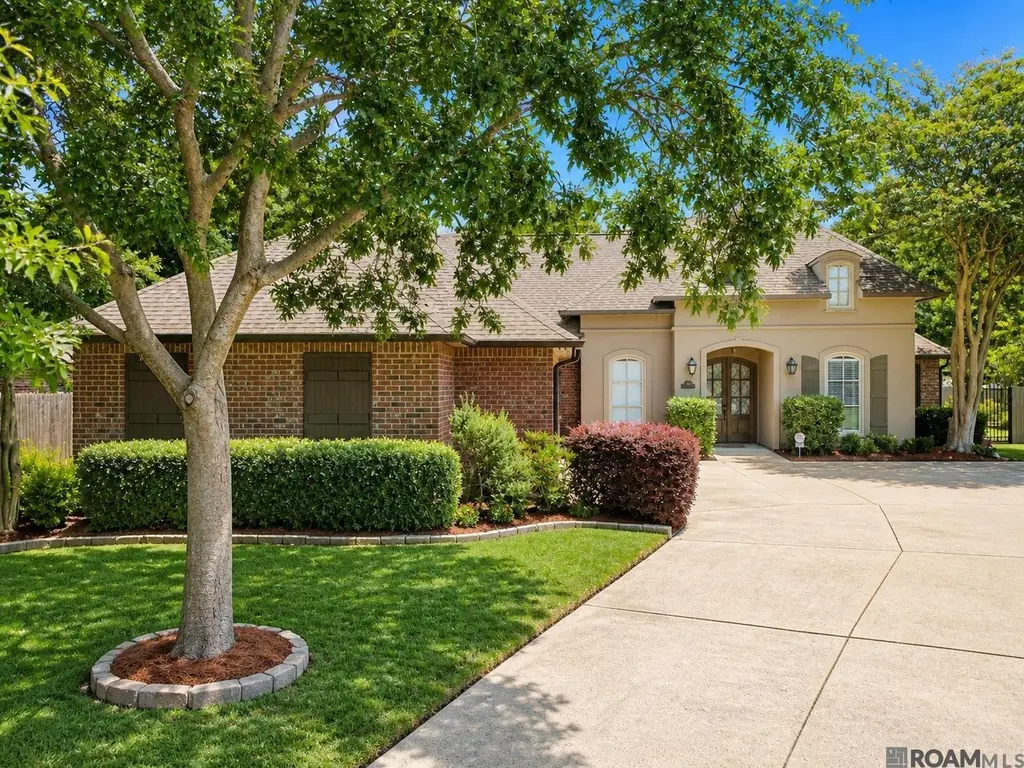
185 Chancellor Ave
St. Gabriel, LA 70776
$460,000D
4 bd · 3.0 ba ·
2,497 sqft ·
Built 2008
· SingleFamily
· Pending
· 7 DOM
Cashflow @ list (25.0% down · 7.5%)
Estimated rent
$3,700/mo
Mortgage (P&I)
−$2,412
Tax + insurance
−$532
HOA
−$40
Vac / Maint / Mgmt
−$777
Net cashflow
$-62/mo
Annual
$-740/yr
Cap rate
6.13%
Cash-on-cash
-0.57%
DSCR
0.97
1% rule
0.80%
Cash to close
$128,800
Investor read
- This is a 4-bed/3.0-bath single-family listed at $460k.
- At list price, monthly cash flow is $-62 ($-740/yr) — negative.
- To cash-flow at today's rent, offer at most $449k (2.4% below list).
- To meet the 1% rule (rent ≥ 1% of price), the offer needs to be $370k (19.6% below list).
- Only 7 days on market — expect competitive offers; lowballing is unlikely to land.
- Recommended offer: $370k (19.6% below list) — sets the bar for 1% rule.
- In year one you build about $11k of equity ($3k loan paydown + $7k appreciation (1.6% local appreciation)).
- Location reads: area grade D — affects rentability + tenant quality, not the cash-flow math above.
- Iberville Parish (rural): math 23% / reading 34% proficiency, ranked #45 of 98 in LA (top 46%) — low school quality limits family demand, transient renter base, plan for 1-2y turnover; 76% free/reduced lunch — lower-income household profile, screen leases tightly.
- Market conditions: 40 active listings in the ZIP; 1 comparable units currently listed for rent nearby; 117 units permitted in Iberville Parish in 2024 (0 in 5+ unit buildings).
- Iberville County population projected to shrink 6% by 2050 — rents likely to lag national; underwrite the cash flow, not the appreciation.
- 2 sale attempts with the ask held roughly flat each time — persistent listings suggest the price (not the market) is what's stuck; bring a comps-based counter.
- Current owner paid $325k; 42% above their basis — modest negotiation headroom, anchor on the comps not their cost.
- At projected returns (1.6% appreciation + 3.0% rent growth), your $129k cash investment doubles in ~9 years — after that, you're playing with house money.
- By year 4, paydown + projected appreciation supports a ~$37k cash-out refi (75% LTV) — recoverable capital for the next deal without selling this one.
- Climate carrying-cost: severe wind risk, 99% chance of damaging wind over 30y; extreme-heat days projected 7→21/yr by 2055 (HVAC capex compounding) — expect insurance premiums to compound above CPI over the hold.
- Cap rate 6.1% vs local median 4.0% in St. Gabriel — top-decile yield for the area; either an underpriced asset or a hidden risk that comps aren't pricing in. Stress-test before assuming the spread holds.
Questions for listing agent
- What do current leases actually rent for vs. the listed asking? Can we see a recent rent roll and the last 12 months of T-12 income?
- What does the HOA fee cover, when was the last increase, and are there any pending special assessments or reserve-fund shortfalls?
- Is there a deadline driving the sale (1031 exchange, divorce, estate, relocation)? That informs how much negotiation room exists.
- The area grade is low — what's the realistic commute time and amenity access for the typical tenant pool here? Any planned neighborhood developments (good or bad) we should know about?
- What's the average days-on-market for RENTAL listings here right now (not sales)? A rising rental-DOM trend means longer vacancies and softer asking-rent achievability than the comps imply.
- What's the recent tenant-quality profile in this submarket — average credit score on applications, eviction rate, late-payment / NSF rate, and stable-employment percentage? A property-management company in the area should have these aggregated.
- How much new for-sale + rental construction is in the pipeline within 1–3 miles? Heavy new supply typically softens prices + rents 12–24 months out; constrained supply supports both.
CashFlowRE · CFR-MZ84005EXFB90N
· Data 3 weeks ago
cashflowre.app · 2026-05-29