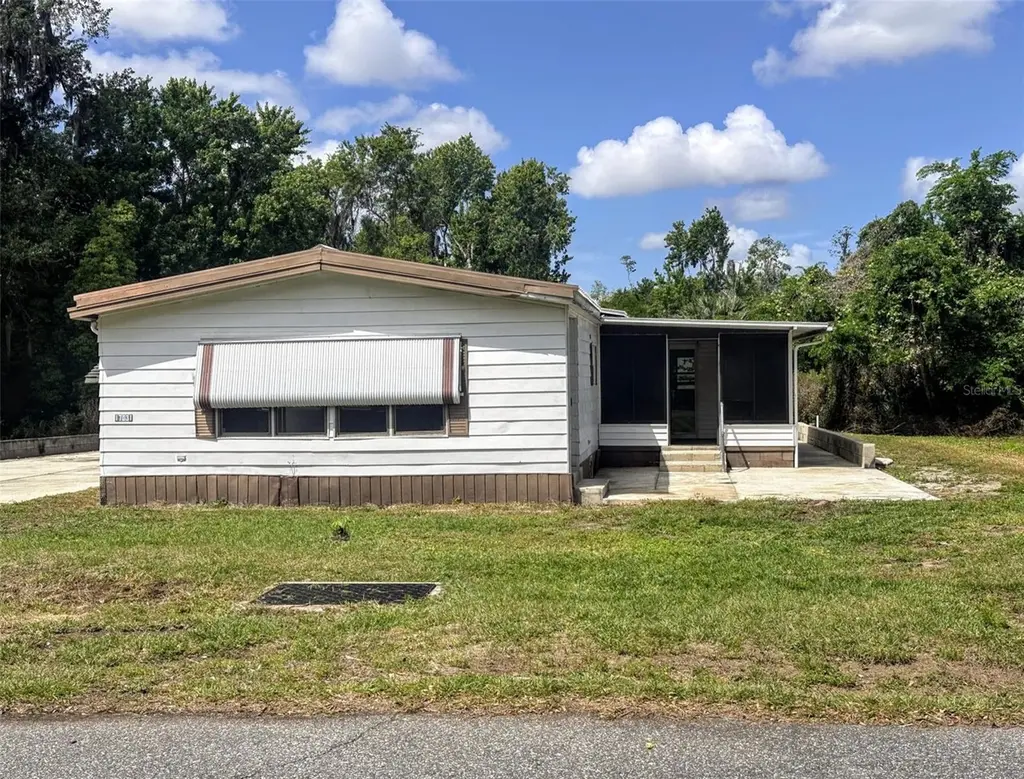
17031 Bay Ave
Montverde, FL 34756
$105,000C+
3 bd · 2.0 ba ·
1,347 sqft ·
Built 1983
· Manufactured
· Pending
· 3 DOM
Cashflow @ list (25.0% down · 7.5%)
Estimated rent
$3,585/mo
Mortgage (P&I)
−$551
Tax + insurance
−$679
HOA
−$30
Vac / Maint / Mgmt
−$753
Net cashflow
$1,573/mo
Annual
$18,874/yr
Cap rate
29.14%
Cash-on-cash
81.61%
DSCR
4.63
1% rule
3.41%
Cash to close
$29,400
Investor read
- This is a 3-bed/2.0-bath manufactured listed at $105k.
- At list price, monthly cash flow is $2k ($19k/yr) — positive.
- The deal already cash-flows at list — no discount required.
- Meets the 1% rule at list price ($4k rent vs $105k).
- Only 3 days on market — expect competitive offers; lowballing is unlikely to land.
- Local home prices are declining (-3.0%/yr); year-one equity from $726 of loan paydown is wiped out by about $3k of value loss. Plan a longer hold.
- Location reads 66/100 on livability (#598 in FL) — a middle-class / working-renter tenant base. Strengths: crime A+, employment A+, housing A+; Watch: cost of living D, amenities F, commute F.
- Lake (suburban): math 49% / reading 50% proficiency, ranked #37 of 73 in FL (top 51%) — families likely to look elsewhere, expect single-tenant / working-renter base with shorter leases.
- Zoned schools: Grassy Lake Elementary School (math 58% / reading 63%, grade B-, #664 of 2,144 statewide, top 32%, 1,209 students, 29% FRL); Lake Minneola High School (math 44% / reading 57%, grade D+, #171 of 667 statewide, top 26%, 2,176 students, 28% FRL) — zoned schools average 29% FRL vs 49% district-wide (20 pts lower); this property's tenant base skews higher-income than the district average.
- Watch-outs: flood insurance adds $427/mo.
- Market conditions: 199 active listings in the ZIP; 2 comparable units currently listed for rent nearby; solid renter incomes; 4,799 units permitted in Lake County in 2024 (814 in 5+ unit buildings).
- Lake County population projected at +37% by 2050 — long-run rental-demand tailwind backs the buy-and-hold thesis.
- Current owner paid $60k; list at $105k implies a 75% gain — meaningful room to come down on a strong offer.
- At projected returns (-3.0% appreciation + 3.0% rent growth), your $29k cash investment doubles in ~2 years — after that, you're playing with house money.
- Climate carrying-cost: in FEMA flood zone AE (mandatory federal flood insurance); severe wind risk, 99% chance of damaging wind over 30y; extreme-heat days projected 7→23/yr by 2055 (HVAC capex compounding) — expect insurance premiums to compound above CPI over the hold.
- Cap rate 29.1% vs local median 2.2% in Montverde — top-decile yield for the area; either an underpriced asset or a hidden risk that comps aren't pricing in. Stress-test before assuming the spread holds.
- This rent runs 40% of the median local income ($108k/yr) — at the standard rent-burdened threshold; future hikes will face affordability resistance.
Questions for listing agent
- What's the actual annual flood-insurance premium (NFIP or private), and is the property in a SFHA with mandatory coverage?
- What does the HOA fee cover, when was the last increase, and are there any pending special assessments or reserve-fund shortfalls?
- Is there a deadline driving the sale (1031 exchange, divorce, estate, relocation)? That informs how much negotiation room exists.
- What's the average days-on-market for RENTAL listings here right now (not sales)? A rising rental-DOM trend means longer vacancies and softer asking-rent achievability than the comps imply.
- What's the recent tenant-quality profile in this submarket — average credit score on applications, eviction rate, late-payment / NSF rate, and stable-employment percentage? A property-management company in the area should have these aggregated.
- How much new for-sale + rental construction is in the pipeline within 1–3 miles? Heavy new supply typically softens prices + rents 12–24 months out; constrained supply supports both.
CashFlowRE · CFR-MZX194C2JKA11S
· Data 3 weeks ago
cashflowre.app · 2026-05-29