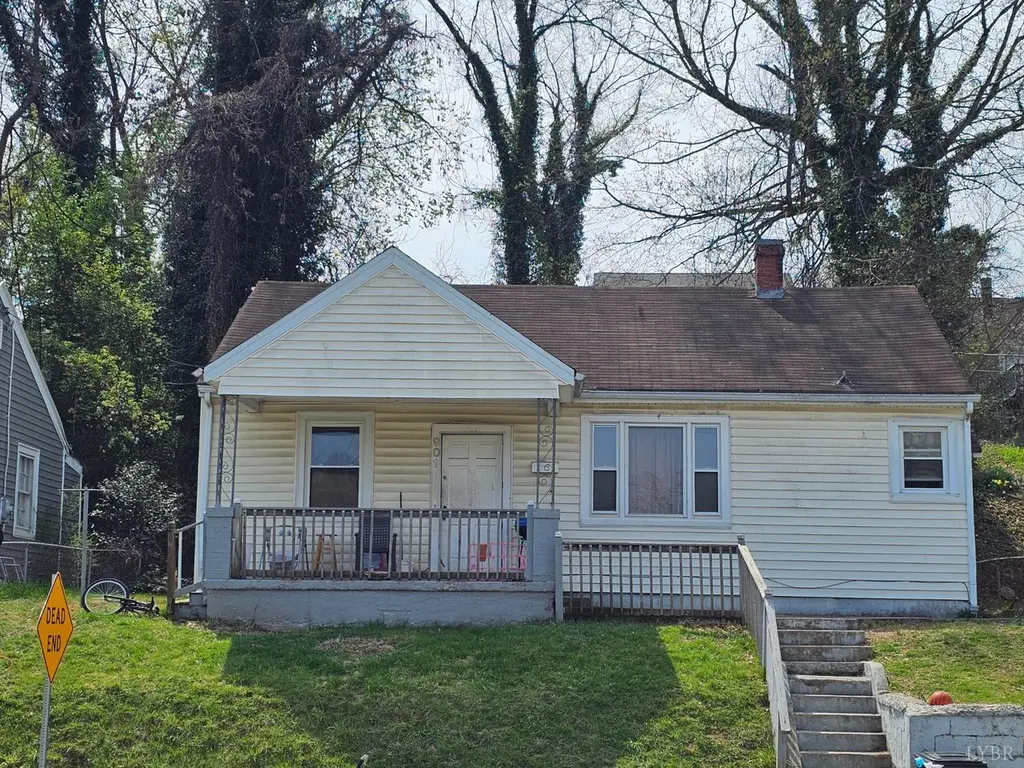
901 Centerdale St
Lynchburg, VA 24501
$99,900B-
2 bd · 1.0 ba ·
928 sqft ·
Built 1939
· SingleFamily
· Pending
· 19 DOM
Cashflow @ list (25.0% down · 7.5%)
Estimated rent
$1,097/mo
Mortgage (P&I)
−$524
Tax + insurance
−$180
HOA
−$0
Vac / Maint / Mgmt
−$230
Net cashflow
$163/mo
Annual
$1,958/yr
Cap rate
9.05%
Cash-on-cash
9.85%
DSCR
1.44
1% rule
1.10%
Cash to close
$27,972
Investor read
- This is a 2-bed/1.0-bath single-family listed at $100k.
- At list price, monthly cash flow is $163 ($2k/yr) — positive.
- The deal already cash-flows at list — no discount required.
- Meets the 1% rule at list price ($1k rent vs $100k).
- It's been on market 19 days — a 2% lower offer ($98k) is reasonable based on typical stale-listing flexibility.
- Recommended offer: $98k (1.5% below list) — sets the bar for market timing.
- Local home prices are declining (-3.0%/yr); year-one equity from $691 of loan paydown is wiped out by about $3k of value loss. Plan a longer hold.
- Location reads 91/100 on livability (#1 in VA, #58 nationally) — a professional / high-income tenant draw. Strengths: amenities A+, commute A+, cost of living A+; Watch: crime C-, employment D+.
- Lynchburg City Public School District (urban): math 36% / reading 61% proficiency, ranked #104 of 131 in VA (top 79%) — families likely to look elsewhere, expect single-tenant / working-renter base with shorter leases; 61% free/reduced lunch — lower-income household profile, screen leases tightly.
- Zoned schools: E.C. Glass High (math 42% / reading 84%, grade B-, #223 of 319 statewide, top 70%, 1,325 students, 92% FRL) — zoned schools average 92% FRL vs 61% district-wide (32 pts higher); higher-poverty schools than district average — tighter screening recommended.
- Zoned-school proficiency averages 63% at this address vs 48% district-wide (+14 pts) — the actual schools serving this property are materially stronger than the Lynchburg City Public School District average implies; a family-tenant draw the district grade alone would hide.
- Watch-outs: flood insurance adds $66/mo; built in 1939 — expect roof / HVAC / electrical / plumbing capex.
- Market conditions: Rents rising (+1.1%/yr); 216 active listings in the ZIP; 30 comparable units currently listed for rent nearby; rentals at typical pace (median 21d on market — plan ~3-4 weeks tenant-placement turnaround); 43% of comp listings sitting > 30 days — soft ceiling on asking rent; lower-income renter base — watch delinquency; 472 units permitted in Lynchburg city in 2024 (240 in 5+ unit buildings).
- Lynchburg County population projected at +37% by 2050 — long-run rental-demand tailwind backs the buy-and-hold thesis.
- Current owner paid $49k; list at $100k implies a 104% gain — meaningful room to come down on a strong offer.
- Climate carrying-cost: severe flood risk; extreme-heat days projected 7→18/yr by 2055 (HVAC capex compounding) — expect insurance premiums to compound above CPI over the hold.
- Cap rate 9.1% vs local median 4.0% in Lynchburg — top-decile yield for the area; either an underpriced asset or a hidden risk that comps aren't pricing in. Stress-test before assuming the spread holds.
- This rent runs 31% of the median local income ($42k/yr) — at the standard rent-burdened threshold; future hikes will face affordability resistance.
Questions for listing agent
- Built in 1939 — when were the roof, HVAC, electrical panel, plumbing, and water heater last replaced?
- What's the actual annual flood-insurance premium (NFIP or private), and is the property in a SFHA with mandatory coverage?
- Is there a deadline driving the sale (1031 exchange, divorce, estate, relocation)? That informs how much negotiation room exists.
- Schools are A-rated — typically a magnet for longer-tenancy family renters. What's the average tenant stay here, and is there a school-zone premium baked into asking?
- What's the average days-on-market for RENTAL listings here right now (not sales)? A rising rental-DOM trend means longer vacancies and softer asking-rent achievability than the comps imply.
- What's the recent tenant-quality profile in this submarket — average credit score on applications, eviction rate, late-payment / NSF rate, and stable-employment percentage? A property-management company in the area should have these aggregated.
- How much new for-sale + rental construction is in the pipeline within 1–3 miles? Heavy new supply typically softens prices + rents 12–24 months out; constrained supply supports both.
CashFlowRE · CFR-N0ASTNC83VAFQ0
· Data 3 weeks ago
cashflowre.app · 2026-05-29