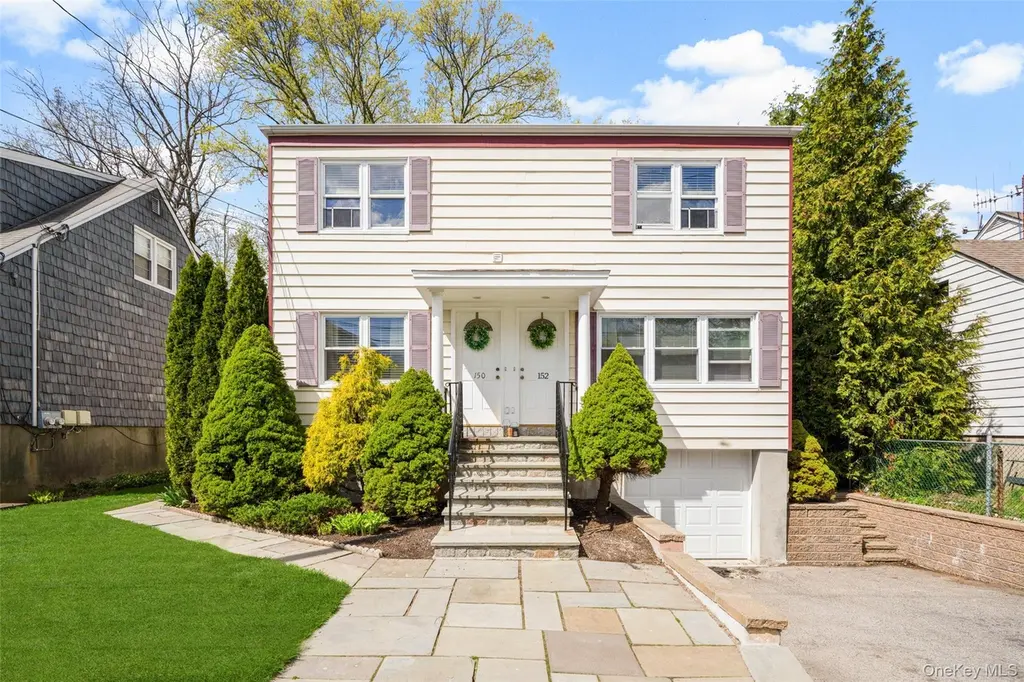
150 Adelphi Ave Unit 150-152
Harrison, NY 10528
$1,100,000C-
6 bd · 2.0 ba ·
2,405 sqft ·
Built 1961
· MultiFamily
· Pending
· 12 DOM
Cashflow @ list (25.0% down · 7.5%)
Estimated rent
$9,007/mo
Mortgage (P&I)
−$5,769
Tax + insurance
−$1,889
HOA
−$0
Vac / Maint / Mgmt
−$1,891
Net cashflow
$-542/mo
Annual
$-6,502/yr
Cap rate
5.76%
Cash-on-cash
-1.89%
DSCR
0.92
1% rule
0.82%
Cash to close
$308,000
Investor read
- This is a 2 × 3-bed/1-bath units multifamily listed at $1.10M. Condition is rated good.
- At list price, monthly cash flow is $-542 ($-7k/yr) — negative. Per door: $-271/mo.
- To cash-flow at today's rent, offer at most $1.02M (7.1% below list).
- To meet the 1% rule (rent ≥ 1% of price), the offer needs to be $901k (18.1% below list).
- Only 12 days on market — expect competitive offers; lowballing is unlikely to land.
- Recommended offer: $901k (18.1% below list) — sets the bar for 1% rule.
- Local home prices are declining (-3.0%/yr); year-one equity from $8k of loan paydown is wiped out by about $33k of value loss. Plan a longer hold.
- Location reads 72/100 on livability (#355 in NY) — a middle-class / working-renter tenant base. Strengths: schools A+, commute A+, employment A+; Watch: housing C-, amenities F, cost of living F.
- Harrison Central School District (suburban): math 69% / reading 72% proficiency, ranked #92 of 590 in NY (top 16%) — strong family-tenant draw, lease renewals of 3-5y typical; only 10% free/reduced lunch — higher-income household profile.
- Watch-outs: flood insurance adds $56/mo.
- Market conditions: Rents rising fast (+9.7%/yr); 63 active listings in the ZIP; 1 comparable units currently listed for rent nearby; high-income renter base; 954 units permitted in Westchester County in 2024 (649 in 5+ unit buildings).
- Westchester County population projected at +10% by 2050 — modest demand growth; plan on rents tracking national, not racing it.
- Climate carrying-cost: major flood risk; major wind risk, 27% chance of damaging wind over 30y; extreme-heat days projected 7→16/yr by 2055 (HVAC capex compounding) — expect insurance premiums to compound above CPI over the hold.
- Cap rate 5.8% vs local median 2.2% in Harrison — top-decile yield for the area; either an underpriced asset or a hidden risk that comps aren't pricing in. Stress-test before assuming the spread holds.
- At $9,007/mo this rent would consume 70% of the median local household income ($154k/yr) (locally 461% of renters already pay >50% of income on rent) — very limited rent-growth headroom before tenants either downsize or default.
Questions for listing agent
- What do current leases actually rent for vs. the listed asking? Can we see a recent rent roll and the last 12 months of T-12 income?
- Can we see the unit-by-unit rent roll, current vacancy, and any below-market leases? What's the average tenancy length?
- What capital expenditures (roof, boiler, parking lot, exteriors) have been made in the last 5 years, and what's planned in the next 2?
- Built in 1961 — when were the roof, HVAC, electrical panel, plumbing, and water heater last replaced?
- What's the actual annual flood-insurance premium (NFIP or private), and is the property in a SFHA with mandatory coverage?
- Is there a deadline driving the sale (1031 exchange, divorce, estate, relocation)? That informs how much negotiation room exists.
- Schools are A-rated — typically a magnet for longer-tenancy family renters. What's the average tenant stay here, and is there a school-zone premium baked into asking?
- What's the average days-on-market for RENTAL listings here right now (not sales)? A rising rental-DOM trend means longer vacancies and softer asking-rent achievability than the comps imply.
CashFlowRE · CFR-N1TS4A9CJ1WR0Z
· Data 3 weeks ago
cashflowre.app · 2026-05-29