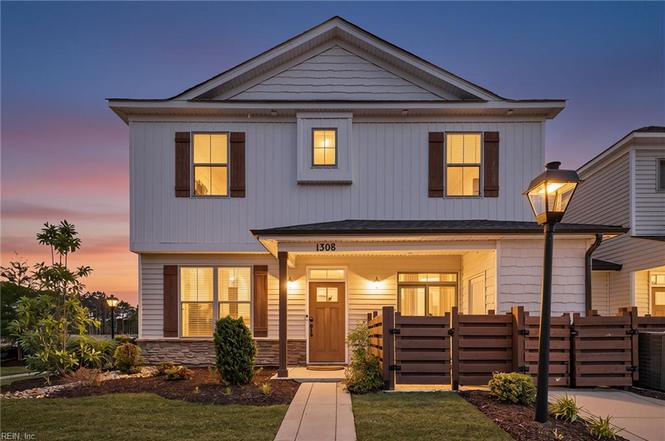
1308 Union Pacific Way
Suffolk, VA 23435
$340,000D-
3 bd · 2.5 ba ·
1,632 sqft ·
Built 2021
· Condo
· Active
· 7 DOM
Cashflow @ list (25.0% down · 7.5%)
Estimated rent
$2,638/mo
Mortgage (P&I)
−$1,783
Tax + insurance
−$430
HOA
−$150
Vac / Maint / Mgmt
−$554
Net cashflow
$-279/mo
Annual
$-3,348/yr
Cap rate
5.31%
Cash-on-cash
-3.52%
DSCR
0.84
1% rule
0.78%
Cash to close
$95,200
Investor read
- This is a 3-bed/2.5-bath condo listed at $340k.
- At list price, monthly cash flow is $-279 ($-3k/yr) — negative.
- To cash-flow at today's rent, offer at most $291k (14.5% below list).
- To meet the 1% rule (rent ≥ 1% of price), the offer needs to be $264k (22.4% below list).
- Only 7 days on market — expect competitive offers; lowballing is unlikely to land.
- Recommended offer: $264k (22.4% below list) — sets the bar for 1% rule.
- Local home prices are declining (-3.0%/yr); year-one equity from $2k of loan paydown is wiped out by about $10k of value loss. Plan a longer hold.
- Location reads 77/100 on livability (#88 in VA, #2,896 nationally) — a middle-class / working-renter tenant base. Strengths: housing A+, health & safety A+, employment A-; Watch: crime C-, commute F.
- Suffolk City Public School District (suburban): math 41% / reading 69% proficiency, ranked #72 of 131 in VA (top 55%) — acceptable for families but not a draw, mixed tenant base, ~2y average lease.
- Zoned schools: Creekside Elementary (math 44% / reading 66%, grade C, #643 of 1,108 statewide, top 59%, 752 students, 65% FRL); Nansemond River High (math 44% / reading 87%, grade B, #204 of 319 statewide, top 65%, 1,698 students, 64% FRL) — zoned schools average 65% FRL vs 39% district-wide (25 pts higher); higher-poverty schools than district average — tighter screening recommended.
- Market conditions: Rents rising fast (+10.6%/yr); 507 active listings in the ZIP; 9 comparable units currently listed for rent nearby; rentals leasing fast (median 8d on market — plan ~1-2 weeks tenant-placement turnaround); high-income renter base; 680 units permitted in Suffolk city in 2024 (0 in 5+ unit buildings).
- Suffolk County population projected at +11% by 2050 — modest demand growth; plan on rents tracking national, not racing it.
- 2 sale attempts since 4y ago with the ask held roughly flat each time — persistent listings suggest the price (not the market) is what's stuck; bring a comps-based counter.
- Cap rate 5.3% vs local median 3.5% in Suffolk — top-decile yield for the area; either an underpriced asset or a hidden risk that comps aren't pricing in. Stress-test before assuming the spread holds.
Questions for listing agent
- What do current leases actually rent for vs. the listed asking? Can we see a recent rent roll and the last 12 months of T-12 income?
- What does the HOA fee cover, when was the last increase, and are there any pending special assessments or reserve-fund shortfalls?
- Any open or pending special assessments — roof, HVAC, plumbing, elevator, façade? What's the per-unit balance and payoff schedule, and is the seller paying it off at close or rolling it to the buyer?
- Is there a deadline driving the sale (1031 exchange, divorce, estate, relocation)? That informs how much negotiation room exists.
- Schools are A-rated — typically a magnet for longer-tenancy family renters. What's the average tenant stay here, and is there a school-zone premium baked into asking?
- The area grade is low — what's the realistic commute time and amenity access for the typical tenant pool here? Any planned neighborhood developments (good or bad) we should know about?
- What's the average days-on-market for RENTAL listings here right now (not sales)? A rising rental-DOM trend means longer vacancies and softer asking-rent achievability than the comps imply.
- What's the recent tenant-quality profile in this submarket — average credit score on applications, eviction rate, late-payment / NSF rate, and stable-employment percentage? A property-management company in the area should have these aggregated.
CashFlowRE · CFR-N3M8ZJBPEHBQ90
· Data 2 days ago
cashflowre.app · 2026-05-29