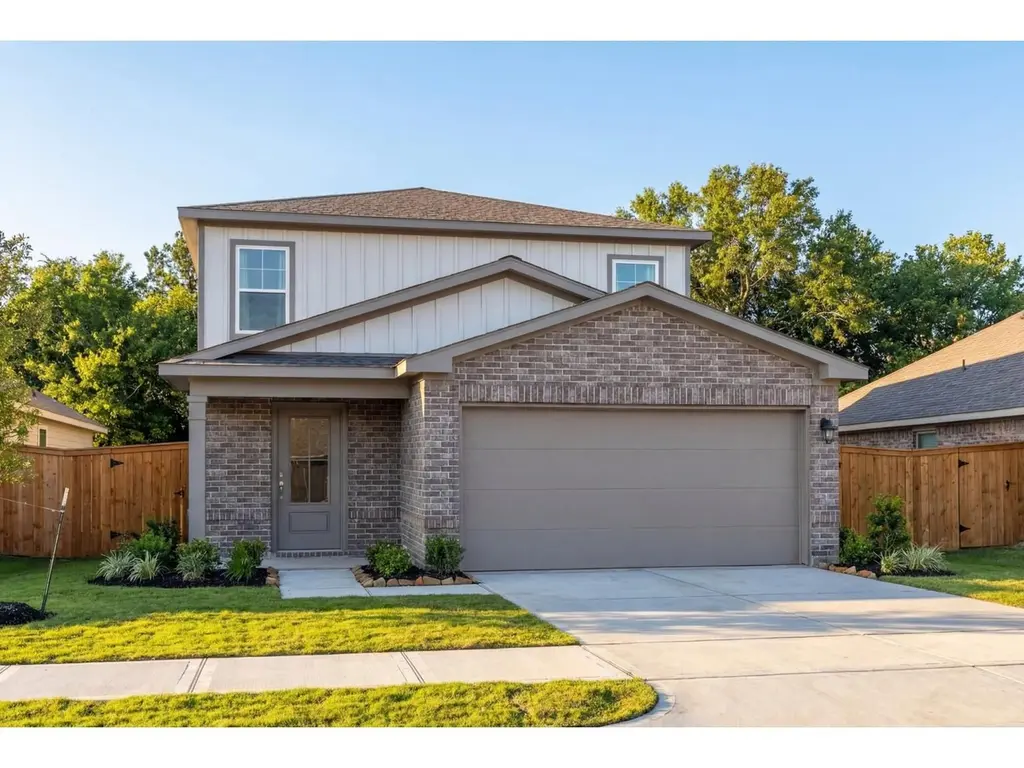
The San Marcos F Plan
Kendleton, TX 77417
$317,990C
5 bd · 3.0 ba ·
2,542 sqft ·
Built —
· SingleFamily
· Active
· 108 DOM
Cashflow @ list (25.0% down · 7.5%)
Estimated rent
$2,965/mo
Mortgage (P&I)
−$1,584
Tax + insurance
−$504
HOA
−$0
Vac / Maint / Mgmt
−$623
Net cashflow
$254/mo
Annual
$3,054/yr
Cap rate
7.30%
Cash-on-cash
3.61%
DSCR
1.16
1% rule
0.98%
Cash to close
$84,593
Investor read
- This is a 5-bed/3.0-bath single-family listed at $318k. Condition is rated good.
- At list price, monthly cash flow is $254 ($3k/yr) — positive.
- The deal already cash-flows at list — no discount required.
- To meet the 1% rule (rent ≥ 1% of price), the offer needs to be $296k (6.8% below list).
- It's been on market 108 days — a 9% lower offer ($289k) is reasonable based on typical stale-listing flexibility.
- Recommended offer: $289k (9.0% below list) — sets the bar for market timing.
- In year one you build about $15k of equity ($2k loan paydown + $13k appreciation (4.2% local appreciation)).
- Location reads 61/100 on livability (#1,021 in TX) — a middle-class / working-renter tenant base. Strengths: cost of living A+, housing A+; Watch: employment D+, crime D, amenities F.
- Lamar CISD (suburban): math 50% / reading 53% proficiency, ranked #116 of 826 in TX (top 14%) — acceptable for families but not a draw, mixed tenant base, ~2y average lease.
- Zoned schools: Beasley El (math 42% / reading 27%, grade F, #1,995 of 4,322 statewide, top 50%, 366 students, 86% FRL); Lamar J H (math 30% / reading 34%, grade F, #971 of 1,662 statewide, top 60%, 1,246 students, 71% FRL); Lamar Cons H S (math 26% / reading 48%, grade F, #897 of 1,632 statewide, top 57%, 1,762 students, 62% FRL) — zoned schools average 73% FRL vs 43% district-wide (30 pts higher); higher-poverty schools than district average — tighter screening recommended.
- Zoned-school proficiency averages 34% at this address vs 52% district-wide (-17 pts) — the specific schools serving this property underperform the Lamar CISD average; the district grade overstates school quality for this exact location.
- Market conditions: 232 active listings in the ZIP; 1 comparable units currently listed for rent nearby; 12,093 units permitted in Fort Bend County in 2024 (815 in 5+ unit buildings).
- Fort Bend County population projected at +75% by 2050 — long-run rental-demand tailwind backs the buy-and-hold thesis.
- At projected returns (4.2% appreciation + 3.0% rent growth), your $85k cash investment doubles in ~5 years — after that, you're playing with house money.
- By year 3, paydown + projected appreciation supports a ~$36k cash-out refi (75% LTV) — recoverable capital for the next deal without selling this one.
Questions for listing agent
- It's been on market 108 days. Have you received any prior offers? Is the seller open to a 9% concession, seller financing, or rate buy-down credit?
- Why hasn't it sold? Are there any deal-killer items the seller is aware of (foundation, flood, title, zoning, code violations)?
- Is there a deadline driving the sale (1031 exchange, divorce, estate, relocation)? That informs how much negotiation room exists.
- Crime grade is D in this area — have there been break-ins, vandalism, or insurance claims at this property in the last 3 years? What carrier currently insures it and at what premium?
- What's the average days-on-market for RENTAL listings here right now (not sales)? A rising rental-DOM trend means longer vacancies and softer asking-rent achievability than the comps imply.
- What's the recent tenant-quality profile in this submarket — average credit score on applications, eviction rate, late-payment / NSF rate, and stable-employment percentage? A property-management company in the area should have these aggregated.
- How much new for-sale + rental construction is in the pipeline within 1–3 miles? Heavy new supply typically softens prices + rents 12–24 months out; constrained supply supports both.
CashFlowRE · CFR-N42PBB1JDQR9JJ
· Data 1 day ago
cashflowre.app · 2026-05-29