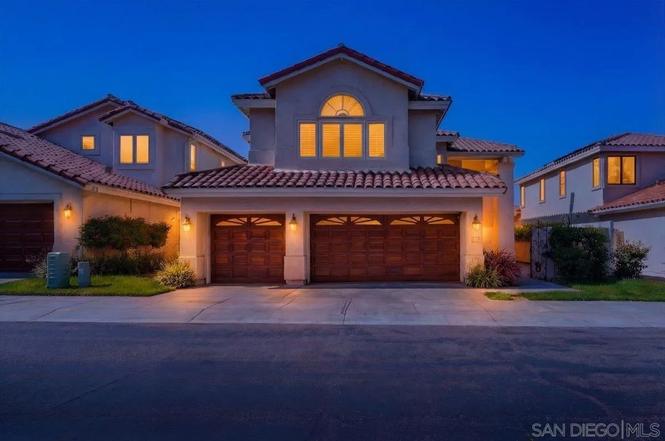
3025 Caminito Torreblanca
San Diego, CA 92014
$2,550,000D+
4 bd · 3.0 ba ·
3,134 sqft ·
Built 1987
· SingleFamily
· Pending
· 53 DOM
Cashflow @ list (25.0% down · 7.5%)
Estimated rent
$13,513/mo
Mortgage (P&I)
−$13,372
Tax + insurance
−$2,479
HOA
−$575
Vac / Maint / Mgmt
−$2,838
Net cashflow
$-5,751/mo
Annual
$-69,012/yr
Cap rate
3.59%
Cash-on-cash
-9.67%
DSCR
0.57
1% rule
0.53%
Cash to close
$714,000
Investor read
- This is a 4-bed/3.0-bath single-family listed at $2.55M.
- At list price, monthly cash flow is $-6k ($-69k/yr) — negative.
- To cash-flow at today's rent, offer at most $1.53M (39.8% below list).
- To meet the 1% rule (rent ≥ 1% of price), the offer needs to be $1.35M (47.0% below list).
- It's been on market 53 days — a 3% lower offer ($2.47M) is reasonable based on typical stale-listing flexibility.
- Recommended offer: $1.35M (47.0% below list) — sets the bar for 1% rule.
- In year one you build about $144k of equity ($18k loan paydown + $126k appreciation (5.0% local appreciation)).
- Location reads 75/100 on livability (#123 in CA, #4,206 nationally) — a middle-class / working-renter tenant base. Strengths: amenities A+, commute A+, employment A+; Watch: health & safety C-, crime D+, cost of living F.
- Solana Beach Elementary (urban): math 82% / reading 86% proficiency, ranked #23 of 1,400 in CA (top 2%) — strong family-tenant draw, lease renewals of 3-5y typical; only 6% free/reduced lunch — higher-income household profile.
- Zoned schools: Skyline Elementary (427 students, 16% FRL); Earl Warren Middle (517 students, 17% FRL); Torrey Pines High (2,614 students, 16% FRL).
- Market conditions: Rents rising fast (+12.7%/yr); 83 active listings in the ZIP; 5 comparable units currently listed for rent nearby; rentals leasing fast (median 0d on market — plan ~1-2 weeks tenant-placement turnaround); high-income renter base; 11,759 units permitted in San Diego County in 2024 (7,244 in 5+ unit buildings).
- San Diego County population projected at +20% by 2050 — long-run rental-demand tailwind backs the buy-and-hold thesis.
- 3 sale attempts since 10y ago; this cycle's ask has dropped $300k (11%) from the opening price — seller is motivated, your offer sets the floor, not the list.
- Current owner paid $1.35M; list at $2.55M implies a 89% gain — meaningful room to come down on a strong offer.
- By year 2, paydown + projected appreciation supports a ~$231k cash-out refi (75% LTV) — recoverable capital for the next deal without selling this one.
- Cap rate 3.6% vs local median 2.0% in San Diego — top-decile yield for the area; either an underpriced asset or a hidden risk that comps aren't pricing in. Stress-test before assuming the spread holds.
- At $13,513/mo this rent would consume 82% of the median local household income ($199k/yr) (locally 343% of renters already pay >50% of income on rent) — very limited rent-growth headroom before tenants either downsize or default.
Questions for listing agent
- What do current leases actually rent for vs. the listed asking? Can we see a recent rent roll and the last 12 months of T-12 income?
- It's been on market 53 days. Have you received any prior offers? Is the seller open to a 47% concession, seller financing, or rate buy-down credit?
- What does the HOA fee cover, when was the last increase, and are there any pending special assessments or reserve-fund shortfalls?
- Is there a deadline driving the sale (1031 exchange, divorce, estate, relocation)? That informs how much negotiation room exists.
- Schools are B-rated — typically a magnet for longer-tenancy family renters. What's the average tenant stay here, and is there a school-zone premium baked into asking?
- Crime grade is D in this area — have there been break-ins, vandalism, or insurance claims at this property in the last 3 years? What carrier currently insures it and at what premium?
- The area grade is low — what's the realistic commute time and amenity access for the typical tenant pool here? Any planned neighborhood developments (good or bad) we should know about?
- What's the average days-on-market for RENTAL listings here right now (not sales)? A rising rental-DOM trend means longer vacancies and softer asking-rent achievability than the comps imply.
CashFlowRE · CFR-N4W8YG7JPDT946
· Data 4 weeks ago
cashflowre.app · 2026-05-29