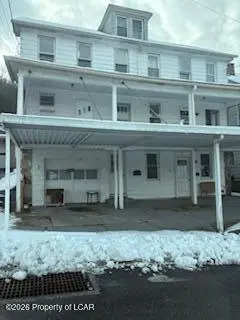
101 /105 105 Ridge St
Nesquehoning, PA 18240
$243,000C-
2 bd · 2.0 ba ·
1,116 sqft ·
Built 1900
· MultiFamily
· Active
· 26 DOM
Cashflow @ list (25.0% down · 7.5%)
Estimated rent
$2,285/mo
Mortgage (P&I)
−$1,274
Tax + insurance
−$254
HOA
−$0
Vac / Maint / Mgmt
−$480
Net cashflow
$277/mo
Annual
$3,322/yr
Cap rate
7.66%
Cash-on-cash
4.88%
DSCR
1.22
1% rule
0.94%
Cash to close
$68,040
Investor read
- This is a 2-bed/2.0-bath multifamily listed at $243k.
- At list price, monthly cash flow is $277 ($3k/yr) — positive.
- The deal already cash-flows at list — no discount required.
- To meet the 1% rule (rent ≥ 1% of price), the offer needs to be $228k (6.0% below list).
- It's been on market 26 days — a 2% lower offer ($239k) is reasonable based on typical stale-listing flexibility.
- Recommended offer: $228k (6.0% below list) — sets the bar for 1% rule.
- Local home prices are declining (-2.1%/yr); year-one equity from $2k of loan paydown is wiped out by about $5k of value loss. Plan a longer hold.
- Location reads 68/100 on livability (#872 in PA) — a middle-class / working-renter tenant base. Strengths: crime A+, cost of living A+, housing A+; Watch: employment C-, amenities F, commute F.
- Panther Valley SD (rural): math 14% / reading 35% proficiency, ranked #477 of 539 in PA (top 88%) — low school quality limits family demand, transient renter base, plan for 1-2y turnover.
- Zoned schools: Panther Valley El Sch (math 27% / reading 42%, grade F, #1,049 of 1,518 statewide, top 71%, 622 students, 100% FRL); Panther Valley Intermediate Sch (math 11% / reading 31%, grade F, #432 of 512 statewide, top 85%, 417 students, 100% FRL); Panther Valley Jshs (math 13% / reading 36%, grade F, #376 of 437 statewide, top 86%, 771 students, 100% FRL) — zoned schools average 100% FRL vs 52% district-wide (48 pts higher); higher-poverty schools than district average — tighter screening recommended.
- Watch-outs: built in 1900 — expect roof / HVAC / electrical / plumbing capex.
- Market conditions: 26 active listings in the ZIP; 6 comparable units currently listed for rent nearby; rentals at typical pace (median 23d on market — plan ~3-4 weeks tenant-placement turnaround); 180 units permitted in Carbon County in 2024 (10 in 5+ unit buildings).
- Carbon County population projected at -18% by 2050 — secular population decline; favor cash flow + early exit over multi-decade hold.
- 5 sale attempts since 4y ago with the ask held roughly flat each time — persistent listings suggest the price (not the market) is what's stuck; bring a comps-based counter.
- Current owner paid $185k; 31% above their basis — modest negotiation headroom, anchor on the comps not their cost.
- Climate carrying-cost: major flood risk — expect insurance premiums to compound above CPI over the hold.
Questions for listing agent
- Built in 1900 — when were the roof, HVAC, electrical panel, plumbing, and water heater last replaced?
- Is there a deadline driving the sale (1031 exchange, divorce, estate, relocation)? That informs how much negotiation room exists.
- Schools are D-rated, which usually means shorter tenancies and higher turnover. Who's the typical renter profile here, and what's been the actual vacancy rate?
- What's the average days-on-market for RENTAL listings here right now (not sales)? A rising rental-DOM trend means longer vacancies and softer asking-rent achievability than the comps imply.
- What's the recent tenant-quality profile in this submarket — average credit score on applications, eviction rate, late-payment / NSF rate, and stable-employment percentage? A property-management company in the area should have these aggregated.
- How much new apartment / multifamily construction is in the pipeline within 1–3 miles? Heavy new supply (>2% of stock underway) typically softens rents 12–24 months out; light construction supports rent growth.
CashFlowRE · CFR-N56XX07A7EQER3
· Data 9 h ago
cashflowre.app · 2026-05-29