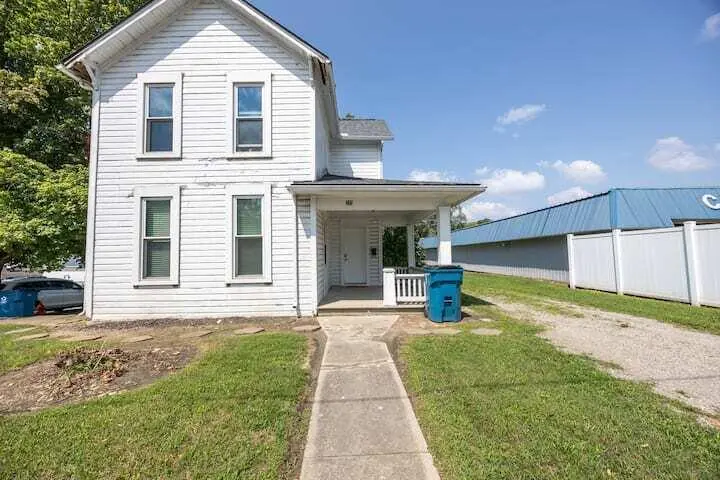
728 S Main St
Bellefontaine, OH 43311
$225,000C-
4 bd · 2.0 ba ·
1,248 sqft ·
Built 1900
· MultiFamily
· Active
· 21 DOM
Cashflow @ list (25.0% down · 7.5%)
Estimated rent
$2,069/mo
Mortgage (P&I)
−$1,180
Tax + insurance
−$211
HOA
−$0
Vac / Maint / Mgmt
−$434
Net cashflow
$244/mo
Annual
$2,928/yr
Cap rate
7.59%
Cash-on-cash
4.65%
DSCR
1.21
1% rule
0.92%
Cash to close
$63,000
Investor read
- This is a 1×3bd/2.0ba + 1×1bd/1.0ba units multifamily listed at $225k.
- At list price, monthly cash flow is $244 ($3k/yr) — positive. Per door: $122/mo.
- The deal already cash-flows at list — no discount required.
- To meet the 1% rule (rent ≥ 1% of price), the offer needs to be $207k (8.0% below list).
- It's been on market 21 days — a 2% lower offer ($222k) is reasonable based on typical stale-listing flexibility.
- Recommended offer: $207k (8.0% below list) — sets the bar for 1% rule.
- Local home prices are declining (-3.0%/yr); year-one equity from $2k of loan paydown is wiped out by about $7k of value loss. Plan a longer hold.
- Location reads 76/100 on livability (#213 in OH, #3,316 nationally) — a middle-class / working-renter tenant base. Strengths: crime A+, cost of living A+, housing A+; Watch: employment D+, amenities F, commute F.
- Bellefontaine City (town): math 55% / reading 59% proficiency, ranked #348 of 656 in OH (top 53%) — acceptable for families but not a draw, mixed tenant base, ~2y average lease.
- Watch-outs: built in 1900 — expect roof / HVAC / electrical / plumbing capex.
- Market conditions: 152 active listings in the ZIP; 121 units permitted in Logan County in 2024 (0 in 5+ unit buildings).
- Logan County population projected at -15% by 2050 — secular population decline; favor cash flow + early exit over multi-decade hold.
- 2 sale attempts since 5y ago with the ask held roughly flat each time — persistent listings suggest the price (not the market) is what's stuck; bring a comps-based counter.
- Current owner paid $75k; list at $225k implies a 200% gain — meaningful room to come down on a strong offer.
- Cap rate 7.6% vs local median 3.6% in Bellefontaine — top-decile yield for the area; either an underpriced asset or a hidden risk that comps aren't pricing in. Stress-test before assuming the spread holds.
- This rent runs 39% of the median local income ($64k/yr) — at the standard rent-burdened threshold; future hikes will face affordability resistance.
Questions for listing agent
- Can we see the unit-by-unit rent roll, current vacancy, and any below-market leases? What's the average tenancy length?
- What capital expenditures (roof, boiler, parking lot, exteriors) have been made in the last 5 years, and what's planned in the next 2?
- Built in 1900 — when were the roof, HVAC, electrical panel, plumbing, and water heater last replaced?
- Is there a deadline driving the sale (1031 exchange, divorce, estate, relocation)? That informs how much negotiation room exists.
- What's the average days-on-market for RENTAL listings here right now (not sales)? A rising rental-DOM trend means longer vacancies and softer asking-rent achievability than the comps imply.
- What's the recent tenant-quality profile in this submarket — average credit score on applications, eviction rate, late-payment / NSF rate, and stable-employment percentage? A property-management company in the area should have these aggregated.
- How much new apartment / multifamily construction is in the pipeline within 1–3 miles? Heavy new supply (>2% of stock underway) typically softens rents 12–24 months out; light construction supports rent growth.
CashFlowRE · CFR-N59J2J779AXQGK
· Data 2 days ago
cashflowre.app · 2026-05-29