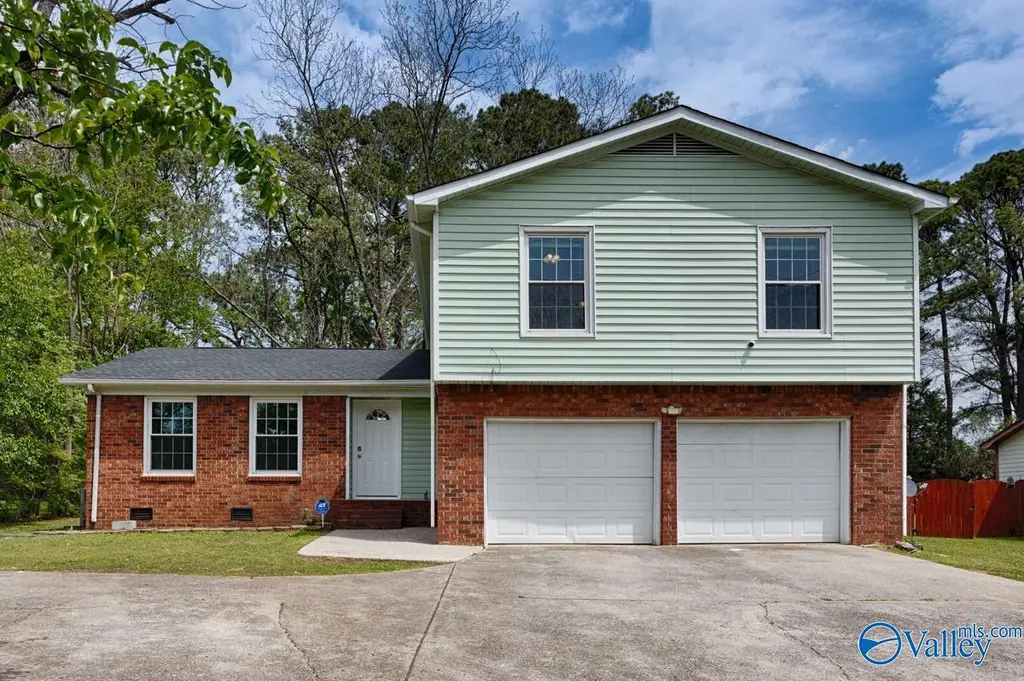
2904 Pulaski Pike NW
Huntsville, AL 35810
$219,900F
4 bd · 1.5 ba ·
1,428 sqft ·
Built 1978
· SingleFamily
· Pending
· 17 DOM
Cashflow @ list (25.0% down · 7.5%)
Estimated rent
$1,641/mo
Mortgage (P&I)
−$1,153
Tax + insurance
−$209
HOA
−$0
Vac / Maint / Mgmt
−$345
Net cashflow
$-66/mo
Annual
$-792/yr
Cap rate
5.93%
Cash-on-cash
-1.29%
DSCR
0.94
1% rule
0.75%
Cash to close
$61,572
Investor read
- This is a 4-bed/1.5-bath single-family listed at $220k.
- At list price, monthly cash flow is $-66 ($-792/yr) — negative.
- To cash-flow at today's rent, offer at most $208k (5.3% below list).
- To meet the 1% rule (rent ≥ 1% of price), the offer needs to be $164k (25.4% below list).
- It's been on market 17 days — a 2% lower offer ($217k) is reasonable based on typical stale-listing flexibility.
- Recommended offer: $164k (25.4% below list) — sets the bar for 1% rule.
- Local home prices are declining (-3.0%/yr); year-one equity from $2k of loan paydown is wiped out by about $7k of value loss. Plan a longer hold.
- Location reads 82/100 on livability (#3 in AL, #1,082 nationally) — a professional / high-income tenant draw. Strengths: commute A+, cost of living A+, housing A+; Watch: crime F.
- Huntsville City (urban): math 21% / reading 46% proficiency, ranked #48 of 129 in AL (top 37%) — families likely to look elsewhere, expect single-tenant / working-renter base with shorter leases.
- Zoned schools: James Dawson Elementary (math 0% / reading 24%, grade F, #536 of 627 statewide, top 88%, 432 students, 88% FRL); Jemison High School (math 12% / reading 12%, grade F, #242 of 305 statewide, top 80%, 843 students, 64% FRL) — zoned schools average 76% FRL vs 46% district-wide (30 pts higher); higher-poverty schools than district average — tighter screening recommended.
- Zoned-school proficiency averages 12% at this address vs 34% district-wide (-21 pts) — the specific schools serving this property underperform the Huntsville City average; the district grade overstates school quality for this exact location.
- Market conditions: Rents soft (-0.1%/yr); 337 active listings in the ZIP; 40 comparable units currently listed for rent nearby; rentals lingering (median 44d on market — plan ~5-8 weeks vacancy on turnover, expect pricing pressure); 55% of comp listings sitting > 30 days — soft ceiling on asking rent; 4,709 units permitted in Madison County in 2024 (1,186 in 5+ unit buildings).
- Madison County population projected at +18% by 2050 — long-run rental-demand tailwind backs the buy-and-hold thesis.
- Climate carrying-cost: extreme-heat days projected 7→18/yr by 2055 (HVAC capex compounding) — expect insurance premiums to compound above CPI over the hold.
- Cap rate 5.9% vs local median 3.8% in Huntsville — top-decile yield for the area; either an underpriced asset or a hidden risk that comps aren't pricing in. Stress-test before assuming the spread holds.
- This rent runs 38% of the median local income ($51k/yr) — at the standard rent-burdened threshold; future hikes will face affordability resistance.
Questions for listing agent
- What do current leases actually rent for vs. the listed asking? Can we see a recent rent roll and the last 12 months of T-12 income?
- Built in 1978 — when were the roof, HVAC, electrical panel, plumbing, and water heater last replaced?
- Is there a deadline driving the sale (1031 exchange, divorce, estate, relocation)? That informs how much negotiation room exists.
- Crime grade is F in this area — have there been break-ins, vandalism, or insurance claims at this property in the last 3 years? What carrier currently insures it and at what premium?
- The area grade is low — what's the realistic commute time and amenity access for the typical tenant pool here? Any planned neighborhood developments (good or bad) we should know about?
- What's the average days-on-market for RENTAL listings here right now (not sales)? A rising rental-DOM trend means longer vacancies and softer asking-rent achievability than the comps imply.
- What's the recent tenant-quality profile in this submarket — average credit score on applications, eviction rate, late-payment / NSF rate, and stable-employment percentage? A property-management company in the area should have these aggregated.
- How much new for-sale + rental construction is in the pipeline within 1–3 miles? Heavy new supply typically softens prices + rents 12–24 months out; constrained supply supports both.
CashFlowRE · CFR-N7D7A91K82RAMW
· Data 3 weeks ago
cashflowre.app · 2026-05-29