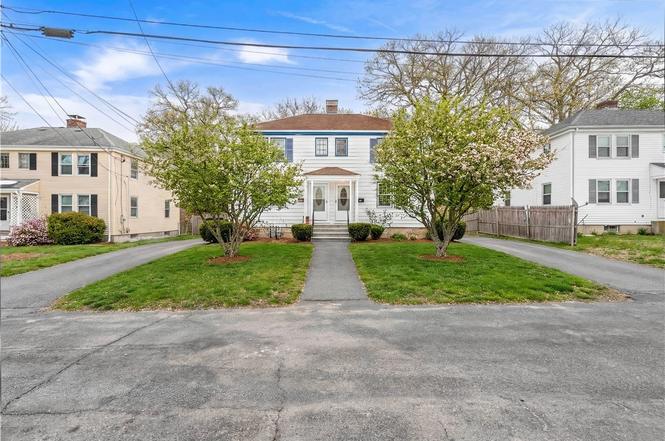
148 Yorktown Rd
North Kingstown, RI 02852
$555,000D+
4 bd · 2.0 ba ·
1,728 sqft ·
Built 1942
· MultiFamily
· Pending
· 20 DOM
Cashflow @ list (25.0% down · 7.5%)
Estimated rent
$5,421/mo
Mortgage (P&I)
−$2,910
Tax + insurance
−$584
HOA
−$0
Vac / Maint / Mgmt
−$1,138
Net cashflow
$788/mo
Annual
$9,456/yr
Cap rate
8.00%
Cash-on-cash
6.09%
DSCR
1.27
1% rule
0.98%
Cash to close
$155,400
Investor read
- This is a 2 × 2-bed/1.0-bath units multifamily listed at $555k.
- At list price, monthly cash flow is $788 ($9k/yr) — positive. Per door: $394/mo.
- The deal already cash-flows at list — no discount required.
- To meet the 1% rule (rent ≥ 1% of price), the offer needs to be $542k (2.3% below list).
- It's been on market 20 days — a 2% lower offer ($547k) is reasonable based on typical stale-listing flexibility.
- Recommended offer: $542k (2.3% below list) — sets the bar for 1% rule.
- Local home prices are declining (-3.0%/yr); year-one equity from $4k of loan paydown is wiped out by about $17k of value loss. Plan a longer hold.
- Location reads: area grade D — affects rentability + tenant quality, not the cash-flow math above.
- North Kingstown (suburban): math 47% / reading 63% proficiency, ranked #5 of 39 in RI (top 13%) — acceptable for families but not a draw, mixed tenant base, ~2y average lease; only 19% free/reduced lunch — higher-income household profile.
- Watch-outs: built in 1942 — expect roof / HVAC / electrical / plumbing capex.
- Market conditions: 99 active listings in the ZIP; 2 comparable units currently listed for rent nearby; high-income renter base; 311 units permitted in Washington County in 2024 (45 in 5+ unit buildings).
- Washington County population projected at -14% by 2050 — secular population decline; favor cash flow + early exit over multi-decade hold.
- 4 sale attempts since 4y ago; this cycle's ask is 8% above the opening price — seller raised mid-cycle; expect resistance to lowballs.
- Current owner paid $355k; list at $555k implies a 56% gain — meaningful room to come down on a strong offer.
- Climate carrying-cost: severe wind risk, 80% chance of damaging wind over 30y; extreme-heat days projected 7→16/yr by 2055 (HVAC capex compounding) — expect insurance premiums to compound above CPI over the hold.
- At $5,421/mo this rent would consume 55% of the median local household income ($119k/yr) (locally 505% of renters already pay >50% of income on rent) — very limited rent-growth headroom before tenants either downsize or default.
Questions for listing agent
- Can we see the unit-by-unit rent roll, current vacancy, and any below-market leases? What's the average tenancy length?
- What capital expenditures (roof, boiler, parking lot, exteriors) have been made in the last 5 years, and what's planned in the next 2?
- Built in 1942 — when were the roof, HVAC, electrical panel, plumbing, and water heater last replaced?
- Is there a deadline driving the sale (1031 exchange, divorce, estate, relocation)? That informs how much negotiation room exists.
- The area grade is low — what's the realistic commute time and amenity access for the typical tenant pool here? Any planned neighborhood developments (good or bad) we should know about?
- What's the average days-on-market for RENTAL listings here right now (not sales)? A rising rental-DOM trend means longer vacancies and softer asking-rent achievability than the comps imply.
- What's the recent tenant-quality profile in this submarket — average credit score on applications, eviction rate, late-payment / NSF rate, and stable-employment percentage? A property-management company in the area should have these aggregated.
- How much new apartment / multifamily construction is in the pipeline within 1–3 miles? Heavy new supply (>2% of stock underway) typically softens rents 12–24 months out; light construction supports rent growth.
CashFlowRE · CFR-NBQV4TFS293NV4
· Data 3 weeks ago
cashflowre.app · 2026-05-29