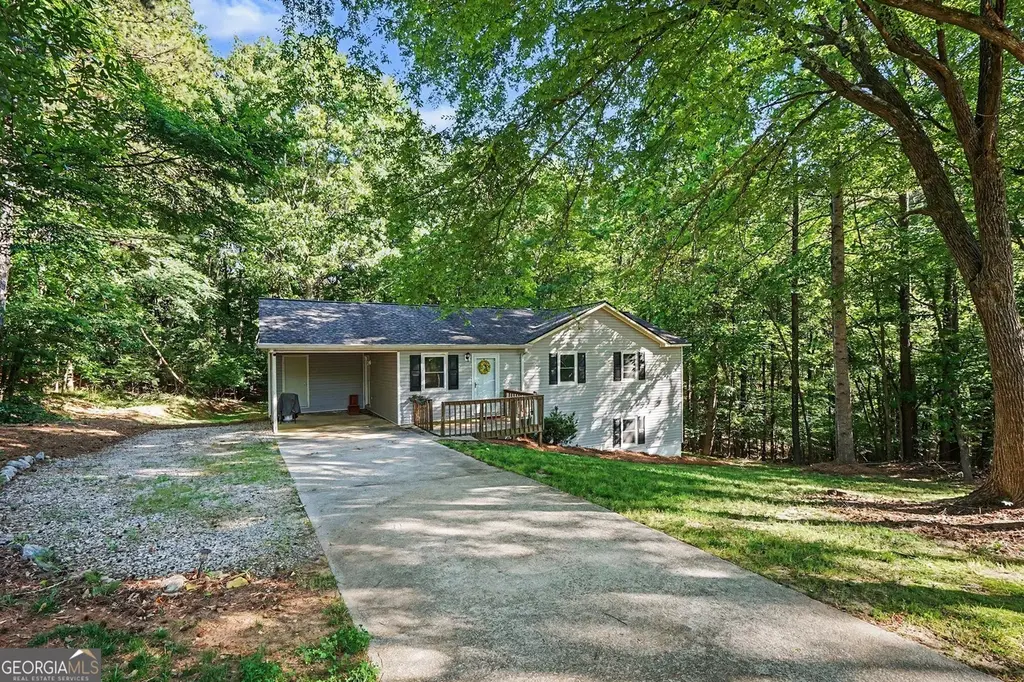
2262 Everett Ct
Loganville, GA 30052
$285,000D
3 bd · 2.0 ba ·
1,099 sqft ·
Built 1997
· SingleFamily
· Pending
· 26 DOM
Cashflow @ list (25.0% down · 7.5%)
Estimated rent
$2,179/mo
Mortgage (P&I)
−$1,495
Tax + insurance
−$329
HOA
−$0
Vac / Maint / Mgmt
−$458
Net cashflow
$-102/mo
Annual
$-1,226/yr
Cap rate
5.86%
Cash-on-cash
-1.54%
DSCR
0.93
1% rule
0.76%
Cash to close
$79,800
Investor read
- This is a 3-bed/2.0-bath single-family listed at $285k.
- At list price, monthly cash flow is $-102 ($-1k/yr) — negative.
- To cash-flow at today's rent, offer at most $267k (6.3% below list).
- To meet the 1% rule (rent ≥ 1% of price), the offer needs to be $218k (23.6% below list).
- It's been on market 26 days — a 2% lower offer ($281k) is reasonable based on typical stale-listing flexibility.
- Recommended offer: $218k (23.6% below list) — sets the bar for 1% rule.
- Local home prices are declining (-3.0%/yr); year-one equity from $2k of loan paydown is wiped out by about $9k of value loss. Plan a longer hold.
- Location reads 74/100 on livability (#39 in GA, #4,689 nationally) — a middle-class / working-renter tenant base. Strengths: crime A+, housing A+, cost of living A-; Watch: amenities F, commute F.
- Walton County (rural): math 43% / reading 41% proficiency, ranked #31 of 174 in GA (top 18%) — families likely to look elsewhere, expect single-tenant / working-renter base with shorter leases.
- Zoned schools: Loganville Elementary School (math 59% / reading 51%, grade C, #178 of 1,228 statewide, top 15%, 1,033 students, 38% FRL); Loganville Middle School (math 46% / reading 48%, grade D+, #89 of 470 statewide, top 20%, 1,320 students, 39% FRL); Loganville High School (math 51% / reading 47%, grade D, #33 of 424 statewide, top 8%, 1,808 students, 30% FRL).
- Market conditions: Rents rising (+3.1%/yr); 865 active listings in the ZIP; solid renter incomes; 677 units permitted in Walton County in 2024 (17 in 5+ unit buildings).
- Walton County population projected at +18% by 2050 — long-run rental-demand tailwind backs the buy-and-hold thesis.
- 10 sale attempts since 5y ago with the ask held roughly flat each time — persistent listings suggest the price (not the market) is what's stuck; bring a comps-based counter.
- Climate carrying-cost: extreme-heat days projected 7→16/yr by 2055 (HVAC capex compounding) — expect insurance premiums to compound above CPI over the hold.
- Cap rate 5.9% vs local median 4.0% in Loganville — top-decile yield for the area; either an underpriced asset or a hidden risk that comps aren't pricing in. Stress-test before assuming the spread holds.
Questions for listing agent
- What do current leases actually rent for vs. the listed asking? Can we see a recent rent roll and the last 12 months of T-12 income?
- Is there a deadline driving the sale (1031 exchange, divorce, estate, relocation)? That informs how much negotiation room exists.
- The area grade is low — what's the realistic commute time and amenity access for the typical tenant pool here? Any planned neighborhood developments (good or bad) we should know about?
- What's the average days-on-market for RENTAL listings here right now (not sales)? A rising rental-DOM trend means longer vacancies and softer asking-rent achievability than the comps imply.
- What's the recent tenant-quality profile in this submarket — average credit score on applications, eviction rate, late-payment / NSF rate, and stable-employment percentage? A property-management company in the area should have these aggregated.
- How much new for-sale + rental construction is in the pipeline within 1–3 miles? Heavy new supply typically softens prices + rents 12–24 months out; constrained supply supports both.
CashFlowRE · CFR-NBXW2E0X5TFF8K
· Data 1 week ago
cashflowre.app · 2026-05-29