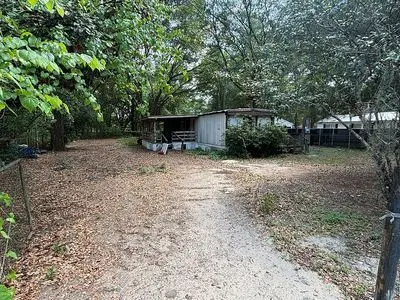
113 Henry St
Interlachen, FL 32148
$40,000B-
2 bd · 1.0 ba ·
720 sqft ·
Built 1973
· Manufactured
· Active
· 13 DOM
Cashflow @ list (25.0% down · 7.5%)
Estimated rent
$975/mo
Mortgage (P&I)
−$210
Tax + insurance
−$93
HOA
−$0
Vac / Maint / Mgmt
−$205
Net cashflow
$467/mo
Annual
$5,605/yr
Cap rate
20.31%
Cash-on-cash
50.05%
DSCR
3.23
1% rule
2.44%
Cash to close
$11,200
Investor read
- This is a 2-bed/1.0-bath manufactured listed at $40k.
- At list price, monthly cash flow is $467 ($6k/yr) — positive.
- The deal already cash-flows at list — no discount required.
- Meets the 1% rule at list price ($975 rent vs $40k).
- Only 13 days on market — expect competitive offers; lowballing is unlikely to land.
- Local home prices are declining (-3.0%/yr); year-one equity from $277 of loan paydown is wiped out by about $1k of value loss. Plan a longer hold.
- Location reads 67/100 on livability (#540 in FL) — a middle-class / working-renter tenant base. Strengths: crime A+, cost of living A+, housing A+; Watch: schools D-, amenities F, commute F.
- Putnam (town): math 34% / reading 39% proficiency, ranked #66 of 73 in FL (top 90%) — families likely to look elsewhere, expect single-tenant / working-renter base with shorter leases; 71% free/reduced lunch — lower-income household profile, screen leases tightly.
- Market conditions: 760 active listings in the ZIP; 1 comparable units currently listed for rent nearby; 113 units permitted in Putnam County in 2024 (0 in 5+ unit buildings).
- Putnam County population projected at -31% by 2050 — secular population decline; favor cash flow + early exit over multi-decade hold.
- Current owner paid $16k; list at $40k implies a 152% gain — meaningful room to come down on a strong offer.
- At projected returns (-3.0% appreciation + 3.0% rent growth), your $11k cash investment doubles in ~3 years — after that, you're playing with house money.
- Climate carrying-cost: severe wind risk, 99% chance of damaging wind over 30y; moderate wildfire risk; extreme-heat days projected 7→20/yr by 2055 (HVAC capex compounding) — expect insurance premiums to compound above CPI over the hold.
- Cap rate 20.3% vs local median 5.6% in Interlachen — top-decile yield for the area; either an underpriced asset or a hidden risk that comps aren't pricing in. Stress-test before assuming the spread holds.
Questions for listing agent
- Built in 1973 — when were the roof, HVAC, electrical panel, plumbing, and water heater last replaced?
- Is there a deadline driving the sale (1031 exchange, divorce, estate, relocation)? That informs how much negotiation room exists.
- Schools are D-rated, which usually means shorter tenancies and higher turnover. Who's the typical renter profile here, and what's been the actual vacancy rate?
- What's the average days-on-market for RENTAL listings here right now (not sales)? A rising rental-DOM trend means longer vacancies and softer asking-rent achievability than the comps imply.
- What's the recent tenant-quality profile in this submarket — average credit score on applications, eviction rate, late-payment / NSF rate, and stable-employment percentage? A property-management company in the area should have these aggregated.
- How much new for-sale + rental construction is in the pipeline within 1–3 miles? Heavy new supply typically softens prices + rents 12–24 months out; constrained supply supports both.
CashFlowRE · CFR-ND34ERC15VDD3Y
· Data 49 min ago
cashflowre.app · 2026-05-29