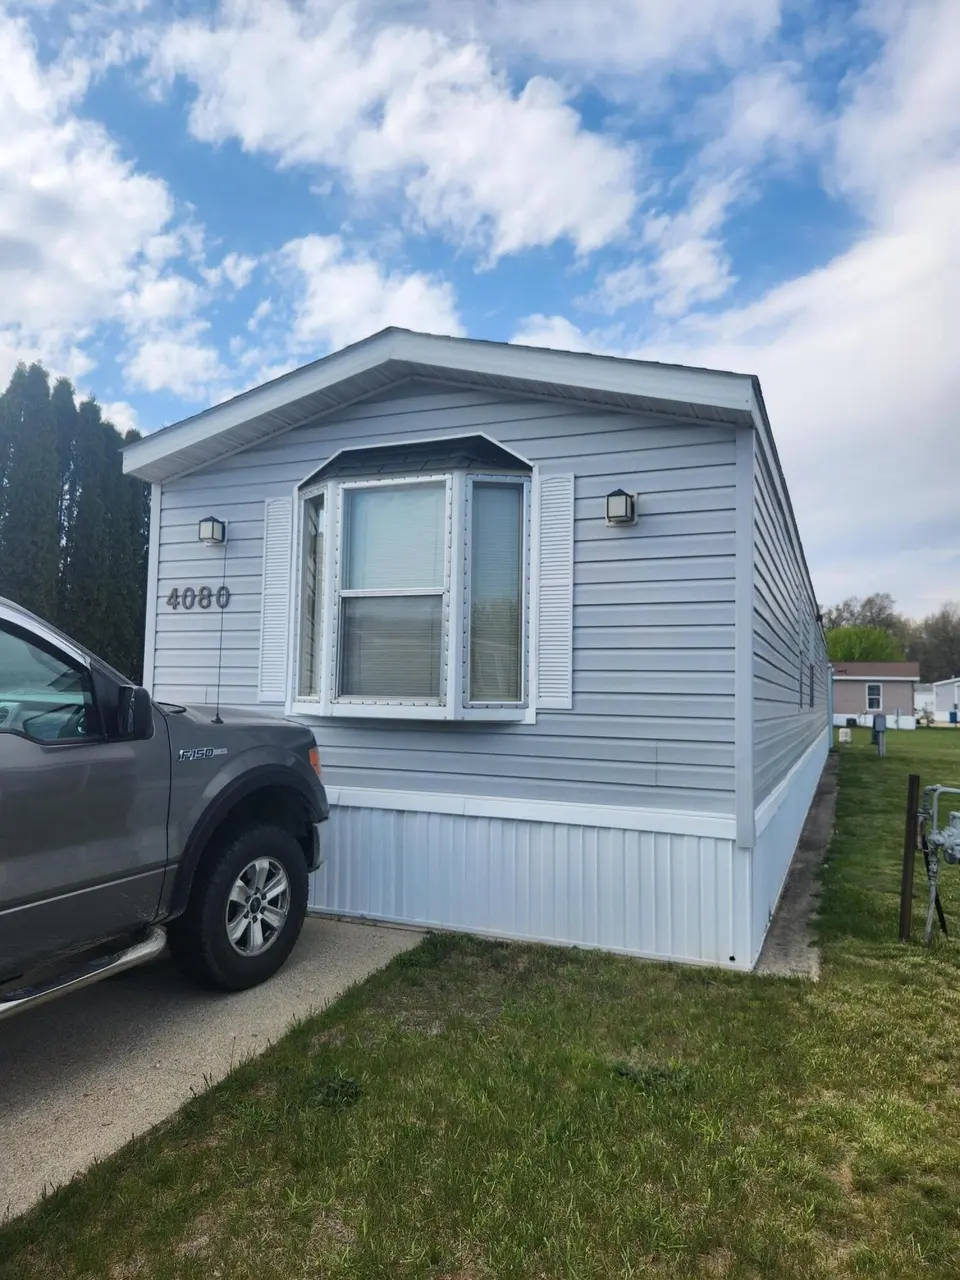
4080 Whisperwood Way S
Egelston, MI 49442
$25,000D
3 bd · 2.0 ba ·
1,120 sqft ·
Built 1990
· Manufactured
· Active
· 44 DOM
Cashflow @ list (25.0% down · 7.5%)
Estimated rent
$1,441/mo
Mortgage (P&I)
−$131
Tax + insurance
−$42
HOA
−$0
Vac / Maint / Mgmt
−$303
Net cashflow
$966/mo
Annual
$11,590/yr
Cap rate
52.65%
Cash-on-cash
165.57%
DSCR
8.37
1% rule
5.77%
Cash to close
$7,000
Investor read
- This is a 3-bed/2.0-bath manufactured listed at $25k. Condition is rated fair.
- At list price, monthly cash flow is $966 ($12k/yr) — positive.
- The deal already cash-flows at list — no discount required.
- Meets the 1% rule at list price ($1k rent vs $25k).
- It's been on market 44 days — a 3% lower offer ($24k) is reasonable based on typical stale-listing flexibility.
- Recommended offer: $24k (3.0% below list) — sets the bar for market timing.
- Local home prices are declining (-3.0%/yr); year-one equity from $173 of loan paydown is wiped out by about $750 of value loss. Plan a longer hold.
- Location reads: area grade D — affects rentability + tenant quality, not the cash-flow math above.
- Oakridge Public Schools (suburban): math 17% / reading 40% proficiency, ranked #389 of 540 in MI (top 72%) — low school quality limits family demand, transient renter base, plan for 1-2y turnover.
- Zoned schools: Oakridge Lower Elementary School (math 32% / reading 42%, grade F, #685 of 1,397 statewide, top 51%, 557 students, 76% FRL); Oakridge Upper Elementary School (math 13% / reading 35%, grade F, #1,030 of 1,397 statewide, top 74%, 421 students, 69% FRL); Oakridge High School (math 22% / reading 47%, grade F, #372 of 713 statewide, top 56%, 561 students, 63% FRL) — zoned schools average 69% FRL vs 54% district-wide (15 pts higher); higher-poverty schools than district average — tighter screening recommended.
- Market conditions: Rents rising fast (+8.2%/yr); 290 active listings in the ZIP; 2 comparable units currently listed for rent nearby; 438 units permitted in Muskegon County in 2024 (115 in 5+ unit buildings).
- Muskegon County population projected to shrink 8% by 2050 — rents likely to lag national; underwrite the cash flow, not the appreciation.
- 3 sale attempts; this cycle's ask has dropped $10k (29%) from the opening price — seller is motivated, your offer sets the floor, not the list.
- At projected returns (-3.0% appreciation + 8.0% rent growth), your $7k cash investment doubles in ~1 year — after that, you're playing with house money.
- This rent runs 36% of the median local income ($49k/yr) — at the standard rent-burdened threshold; future hikes will face affordability resistance.
Questions for listing agent
- It's been on market 44 days. Have you received any prior offers? Is the seller open to a 3% concession, seller financing, or rate buy-down credit?
- Have any recent inspections been done? Can we get a copy of the seller's disclosures and any deferred-maintenance estimates?
- Is there a deadline driving the sale (1031 exchange, divorce, estate, relocation)? That informs how much negotiation room exists.
- The area grade is low — what's the realistic commute time and amenity access for the typical tenant pool here? Any planned neighborhood developments (good or bad) we should know about?
- What's the average days-on-market for RENTAL listings here right now (not sales)? A rising rental-DOM trend means longer vacancies and softer asking-rent achievability than the comps imply.
- What's the recent tenant-quality profile in this submarket — average credit score on applications, eviction rate, late-payment / NSF rate, and stable-employment percentage? A property-management company in the area should have these aggregated.
- How much new for-sale + rental construction is in the pipeline within 1–3 miles? Heavy new supply typically softens prices + rents 12–24 months out; constrained supply supports both.
Repairs flagged (vision-AI assessment)
- Moderate: Kitchen cabinets — Worn condition
- Minor: Bathroom fixtures — Possible minor wear
- Minor: Flooring — Worn carpet
- Minor: Paint — Chipped paint
CashFlowRE · CFR-NDD3T86H0X318H
· Data 12 h ago
cashflowre.app · 2026-05-29