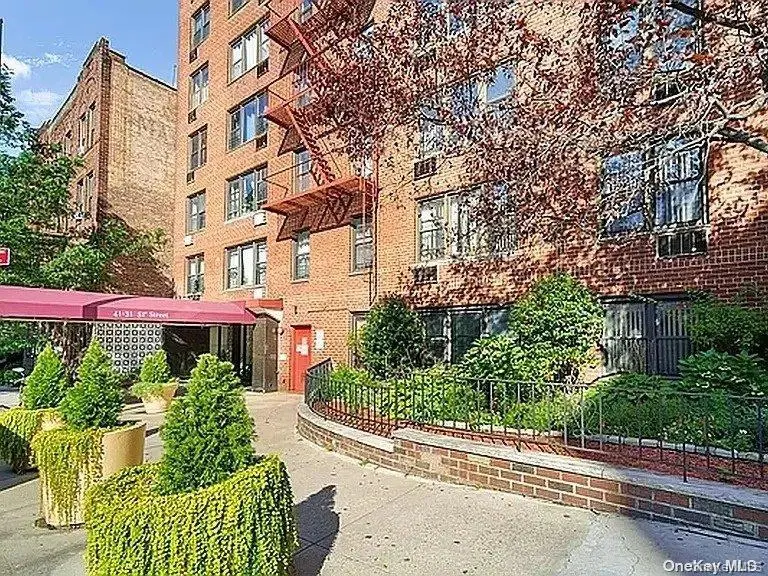
41-31 51 St Unit 6M
New York, NY 11377
$289,000C
1 bd · 1.0 ba ·
650 sqft ·
Built 1964
· Condo
· Active
· 355 DOM
Cashflow @ list (25.0% down · 7.5%)
Estimated rent
$3,207/mo
Mortgage (P&I)
−$1,516
Tax + insurance
−$482
HOA
−$0
Vac / Maint / Mgmt
−$673
Net cashflow
$536/mo
Annual
$6,434/yr
Cap rate
8.52%
Cash-on-cash
7.95%
DSCR
1.35
1% rule
1.11%
Cash to close
$80,920
Investor read
- This is a 1-bed/1.0-bath condo listed at $289k.
- At list price, monthly cash flow is $536 ($6k/yr) — positive.
- The deal already cash-flows at list — no discount required.
- Meets the 1% rule at list price ($3k rent vs $289k).
- It's been on market 355 days — a 12% lower offer ($254k) is reasonable based on typical stale-listing flexibility.
- Recommended offer: $254k (12.0% below list) — sets the bar for market timing.
- Local home prices are declining (-3.0%/yr); year-one equity from $2k of loan paydown is wiped out by about $9k of value loss. Plan a longer hold.
- Location reads 75/100 on livability (#268 in NY, #4,188 nationally) — a middle-class / working-renter tenant base. Strengths: amenities A+, commute A+, health & safety A; Watch: crime F, cost of living F.
- Zoned schools: Elm Tree Elementary School (math 27% / reading 52%, grade F, #1,444 of 2,108 statewide, top 71%, 806 students, 94% FRL); Is 227 Louis Armstrong (math 52% / reading 69%, grade B+, #153 of 729 statewide, top 21%, 1,528 students, 68% FRL); Midwood High School (math 94% / reading 96%, grade A+, #83 of 1,100 statewide, top 8%, 4,062 students, 73% FRL).
- Market conditions: Rents rising fast (+6.1%/yr); 351 active listings in the ZIP; 2 comparable units currently listed for rent nearby; 5,302 units permitted in Queens County in 2024 (4,918 in 5+ unit buildings).
- Queens County population projected at +16% by 2050 — long-run rental-demand tailwind backs the buy-and-hold thesis.
- 2 sale attempts since 2y ago with the ask held roughly flat each time — persistent listings suggest the price (not the market) is what's stuck; bring a comps-based counter.
- At projected returns (-3.0% appreciation + 6.1% rent growth), your $81k cash investment doubles in ~9 years — after that, you're playing with house money.
- Cap rate 8.5% vs local median 2.6% in New York — top-decile yield for the area; either an underpriced asset or a hidden risk that comps aren't pricing in. Stress-test before assuming the spread holds.
- At $3,207/mo this rent would consume 53% of the median local household income ($73k/yr) (locally 5474% of renters already pay >50% of income on rent) — very limited rent-growth headroom before tenants either downsize or default.
Questions for listing agent
- It's been on market 355 days. Have you received any prior offers? Is the seller open to a 12% concession, seller financing, or rate buy-down credit?
- Built in 1964 — when were the roof, HVAC, electrical panel, plumbing, and water heater last replaced?
- Any open or pending special assessments — roof, HVAC, plumbing, elevator, façade? What's the per-unit balance and payoff schedule, and is the seller paying it off at close or rolling it to the buyer?
- Why hasn't it sold? Are there any deal-killer items the seller is aware of (foundation, flood, title, zoning, code violations)?
- Is there a deadline driving the sale (1031 exchange, divorce, estate, relocation)? That informs how much negotiation room exists.
- Schools are B-rated — typically a magnet for longer-tenancy family renters. What's the average tenant stay here, and is there a school-zone premium baked into asking?
- Crime grade is F in this area — have there been break-ins, vandalism, or insurance claims at this property in the last 3 years? What carrier currently insures it and at what premium?
- What's the average days-on-market for RENTAL listings here right now (not sales)? A rising rental-DOM trend means longer vacancies and softer asking-rent achievability than the comps imply.
CashFlowRE · CFR-NF01GM3RQ5S13A
· Data 1 day ago
cashflowre.app · 2026-05-29