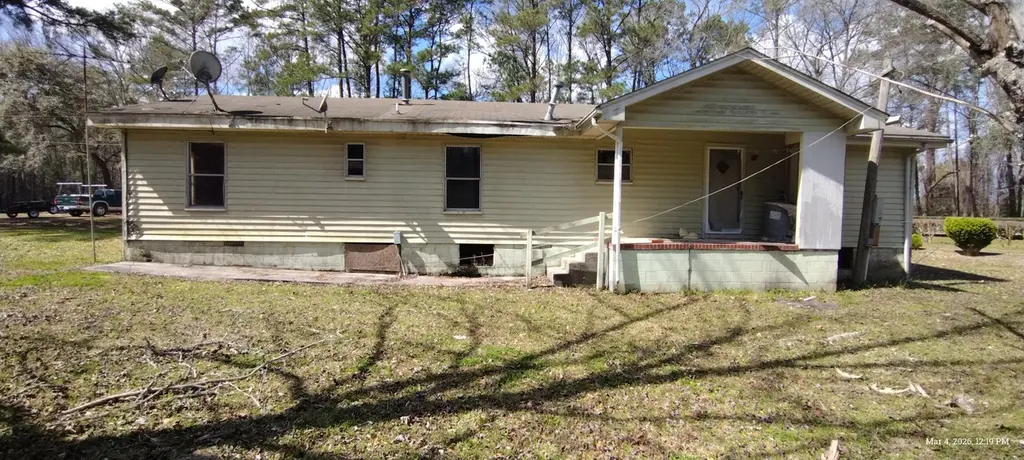
5834 Caboose Ave
Hollywood, SC 29470
$36,400D
4 bd · 2.0 ba ·
1,440 sqft ·
Built 1977
· Other
· Pending
Cashflow @ list (25.0% down · 7.5%)
Estimated rent
$2,052/mo
Mortgage (P&I)
−$191
Tax + insurance
−$21
HOA
−$0
Vac / Maint / Mgmt
−$431
Net cashflow
$1,409/mo
Annual
$16,907/yr
Cap rate
52.74%
Cash-on-cash
165.88%
DSCR
8.38
1% rule
5.64%
Cash to close
$10,192
Investor read
- This is a 4-bed/2.0-bath other listed at $36k.
- At list price, monthly cash flow is $1k ($17k/yr) — positive.
- The deal already cash-flows at list — no discount required.
- Meets the 1% rule at list price ($2k rent vs $36k).
- Only 0 days on market — expect competitive offers; lowballing is unlikely to land.
- Local home prices are declining (-3.0%/yr); year-one equity from $252 of loan paydown is wiped out by about $1k of value loss. Plan a longer hold.
- Location reads 60/100 on livability (#220 in SC) — a middle-class / working-renter tenant base. Strengths: crime A+, housing A+, cost of living B+; Watch: amenities F, commute F, health & safety F.
- Charleston 01 (urban): math 48% / reading 53% proficiency, ranked #7 of 80 in SC (top 9%) — acceptable for families but not a draw, mixed tenant base, ~2y average lease.
- Zoned schools: E.B. Ellington Elementary (math 12% / reading 8%, grade F, #587 of 597 statewide, top 99%, 353 students, 100% FRL); St. Johns High (math 42% / reading 72%, grade C, #120 of 196 statewide, top 64%, 387 students, 100% FRL) — zoned schools average 100% FRL vs 44% district-wide (56 pts higher); higher-poverty schools than district average — tighter screening recommended.
- Zoned-school proficiency averages 33% at this address vs 50% district-wide (-17 pts) — the specific schools serving this property underperform the Charleston 01 average; the district grade overstates school quality for this exact location.
- Market conditions: 196 active listings in the ZIP; 2 comparable units currently listed for rent nearby; 4,156 units permitted in Charleston County in 2024 (857 in 5+ unit buildings).
- Charleston County population projected at +44% by 2050 — long-run rental-demand tailwind backs the buy-and-hold thesis.
- At projected returns (-3.0% appreciation + 3.0% rent growth), your $10k cash investment doubles in ~1 year — after that, you're playing with house money.
- Climate carrying-cost: severe wind risk, 99% chance of damaging wind over 30y; moderate wildfire risk; extreme-heat days projected 7→18/yr by 2055 (HVAC capex compounding) — expect insurance premiums to compound above CPI over the hold.
- Cap rate 52.7% vs local median 1.0% in Hollywood — top-decile yield for the area; either an underpriced asset or a hidden risk that comps aren't pricing in. Stress-test before assuming the spread holds.
Questions for listing agent
- Built in 1977 — when were the roof, HVAC, electrical panel, plumbing, and water heater last replaced?
- Is there a deadline driving the sale (1031 exchange, divorce, estate, relocation)? That informs how much negotiation room exists.
- Schools are F-rated, which usually means shorter tenancies and higher turnover. Who's the typical renter profile here, and what's been the actual vacancy rate?
- The area grade is low — what's the realistic commute time and amenity access for the typical tenant pool here? Any planned neighborhood developments (good or bad) we should know about?
- What's the average days-on-market for RENTAL listings here right now (not sales)? A rising rental-DOM trend means longer vacancies and softer asking-rent achievability than the comps imply.
- What's the recent tenant-quality profile in this submarket — average credit score on applications, eviction rate, late-payment / NSF rate, and stable-employment percentage? A property-management company in the area should have these aggregated.
- How much new for-sale + rental construction is in the pipeline within 1–3 miles? Heavy new supply typically softens prices + rents 12–24 months out; constrained supply supports both.
CashFlowRE · CFR-NFRKPD6XG9ESAE
· Data 6 days ago
cashflowre.app · 2026-05-29