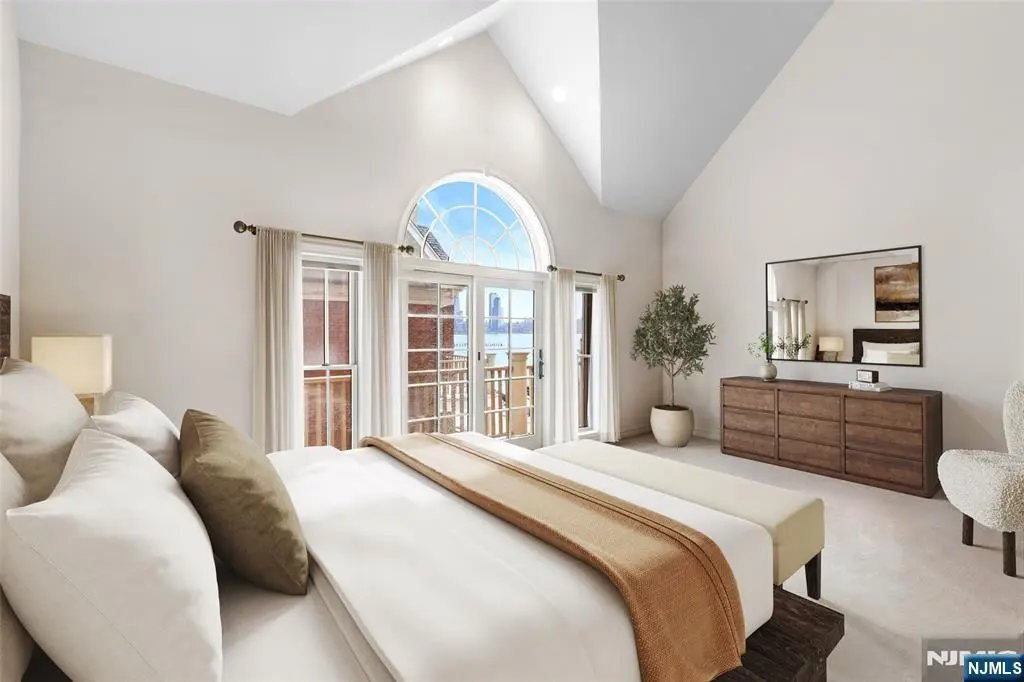
36 Regency Pl Unit TH - 36
Union City, NJ 07086
$2,495,000F
4 bd · 4.0 ba ·
— sqft ·
Built —
· Townhouse
· Active
· 45 DOM
Cashflow @ list (25.0% down · 7.5%)
Estimated rent
$4,694/mo
Mortgage (P&I)
−$13,084
Tax + insurance
−$4,158
HOA
−$1,365
Vac / Maint / Mgmt
−$986
Net cashflow
$-14,899/mo
Annual
$-178,785/yr
Cap rate
-0.87%
Cash-on-cash
-25.59%
DSCR
-0.14
1% rule
0.19%
Cash to close
$698,600
Investor read
- This is a 4-bed/4.0-bath townhouse listed at $2.50M. Condition is rated good.
- At list price, monthly cash flow is $-15k ($-179k/yr) — negative.
- To cash-flow at today's rent, offer at most $339k (86.4% below list).
- To meet the 1% rule (rent ≥ 1% of price), the offer needs to be $469k (81.2% below list).
- It's been on market 45 days — a 3% lower offer ($2.42M) is reasonable based on typical stale-listing flexibility.
- Recommended offer: $339k (86.4% below list) — sets the bar for cash-flow.
- In year one you build about $77k of equity ($17k loan paydown + $59k appreciation (2.4% local appreciation)).
- Location reads 77/100 on livability (#117 in NJ, #2,998 nationally) — a middle-class / working-renter tenant base. Strengths: amenities A+, commute A+, health & safety A; Watch: cost of living F.
- Weehawken Public School District (suburban): math 21% / reading 55% proficiency, ranked #232 of 472 in NJ (top 49%) — families likely to look elsewhere, expect single-tenant / working-renter base with shorter leases.
- Watch-outs: HOA is 29% of rent.
- Market conditions: Rents rising (+3.2%/yr); 81 active listings in the ZIP; 40 comparable units currently listed for rent nearby; rentals at typical pace (median 25d on market — plan ~3-4 weeks tenant-placement turnaround); high-income renter base; 5,310 units permitted in Hudson County in 2024 (4,154 in 5+ unit buildings).
- Hudson County population projected at +29% by 2050 — long-run rental-demand tailwind backs the buy-and-hold thesis.
- 3 sale attempts; this cycle's ask is 19860% above the opening price — seller raised mid-cycle; expect resistance to lowballs.
- By year 3, paydown + projected appreciation supports a ~$193k cash-out refi (75% LTV) — recoverable capital for the next deal without selling this one.
- Cap rate -0.9% vs local median 2.3% in Union City — below-typical yield; the buyer is paying a premium for something (appreciation thesis, condition, location) that the cap rate doesn't capture.
- This rent runs 44% of the median local income ($128k/yr) — at the standard rent-burdened threshold; future hikes will face affordability resistance.
Questions for listing agent
- What do current leases actually rent for vs. the listed asking? Can we see a recent rent roll and the last 12 months of T-12 income?
- It's been on market 45 days. Have you received any prior offers? Is the seller open to a 86% concession, seller financing, or rate buy-down credit?
- What does the HOA fee cover, when was the last increase, and are there any pending special assessments or reserve-fund shortfalls?
- Is there a deadline driving the sale (1031 exchange, divorce, estate, relocation)? That informs how much negotiation room exists.
- The area grade is low — what's the realistic commute time and amenity access for the typical tenant pool here? Any planned neighborhood developments (good or bad) we should know about?
- What's the average days-on-market for RENTAL listings here right now (not sales)? A rising rental-DOM trend means longer vacancies and softer asking-rent achievability than the comps imply.
- What's the recent tenant-quality profile in this submarket — average credit score on applications, eviction rate, late-payment / NSF rate, and stable-employment percentage? A property-management company in the area should have these aggregated.
- How much new for-sale + rental construction is in the pipeline within 1–3 miles? Heavy new supply typically softens prices + rents 12–24 months out; constrained supply supports both.
CashFlowRE · CFR-NGKRB97ESFMQJS
· Data 2 weeks ago
cashflowre.app · 2026-05-29