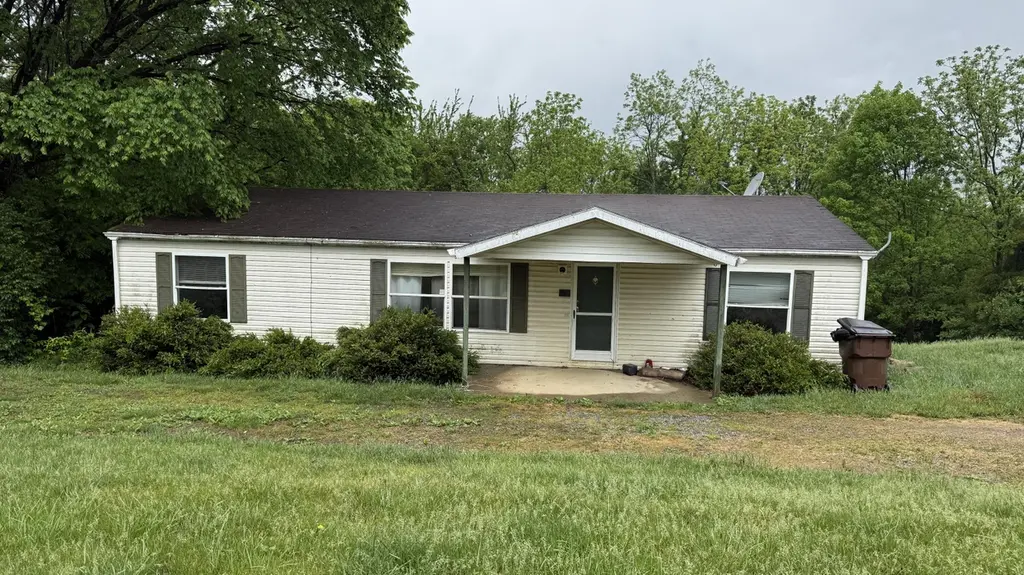
511 Tom Hackley Rd
Danville, KY 40422
$120,000C+
3 bd · 2.0 ba ·
1,152 sqft ·
Built 1996
· SingleFamily
· Active
· 28 DOM
Cashflow @ list (25.0% down · 7.5%)
Estimated rent
$1,372/mo
Mortgage (P&I)
−$629
Tax + insurance
−$76
HOA
−$0
Vac / Maint / Mgmt
−$288
Net cashflow
$379/mo
Annual
$4,547/yr
Cap rate
10.08%
Cash-on-cash
13.53%
DSCR
1.60
1% rule
1.14%
Cash to close
$33,600
Investor read
- This is a 3-bed/2.0-bath single-family listed at $120k.
- At list price, monthly cash flow is $379 ($5k/yr) — positive.
- The deal already cash-flows at list — no discount required.
- Meets the 1% rule at list price ($1k rent vs $120k).
- It's been on market 28 days — a 2% lower offer ($118k) is reasonable based on typical stale-listing flexibility.
- Recommended offer: $118k (1.5% below list) — sets the bar for market timing.
- Local home prices are declining (-3.0%/yr); year-one equity from $830 of loan paydown is wiped out by about $4k of value loss. Plan a longer hold.
- Location reads 77/100 on livability (#85 in KY, #3,148 nationally) — a middle-class / working-renter tenant base. Strengths: crime A+, cost of living A+, health & safety A+; Watch: amenities F, commute F, employment F.
- Lincoln County (rural): math 20% / reading 35% proficiency, ranked #131 of 165 in KY (top 79%) — low school quality limits family demand, transient renter base, plan for 1-2y turnover.
- Zoned schools: Stanford Elementary School (math 17% / reading 36%, grade F, #469 of 676 statewide, top 70%, 589 students, 70% FRL); Lincoln County Middle School (math 18% / reading 38%, grade F, #165 of 217 statewide, top 77%, 745 students, 67% FRL); Lincoln County High School (math 24% / reading 32%, grade F, #151 of 254 statewide, top 61%, 951 students, 63% FRL).
- Market conditions: 165 active listings in the ZIP; 91 units permitted in Lincoln County in 2024 (0 in 5+ unit buildings).
- Lincoln County population projected at -23% by 2050 — secular population decline; favor cash flow + early exit over multi-decade hold.
- 2 sale attempts since 25y ago with the ask held roughly flat each time — persistent listings suggest the price (not the market) is what's stuck; bring a comps-based counter.
- Current owner paid $33k; list at $120k implies a 264% gain — meaningful room to come down on a strong offer.
- At projected returns (-3.0% appreciation + 3.0% rent growth), your $34k cash investment doubles in ~9 years — after that, you're playing with house money.
- Cap rate 10.1% vs local median 3.0% in Danville — top-decile yield for the area; either an underpriced asset or a hidden risk that comps aren't pricing in. Stress-test before assuming the spread holds.
Questions for listing agent
- Is there a deadline driving the sale (1031 exchange, divorce, estate, relocation)? That informs how much negotiation room exists.
- What's the average days-on-market for RENTAL listings here right now (not sales)? A rising rental-DOM trend means longer vacancies and softer asking-rent achievability than the comps imply.
- What's the recent tenant-quality profile in this submarket — average credit score on applications, eviction rate, late-payment / NSF rate, and stable-employment percentage? A property-management company in the area should have these aggregated.
- How much new for-sale + rental construction is in the pipeline within 1–3 miles? Heavy new supply typically softens prices + rents 12–24 months out; constrained supply supports both.
CashFlowRE · CFR-NHAMEZ830PXSBW
· Data 1 day ago
cashflowre.app · 2026-05-29