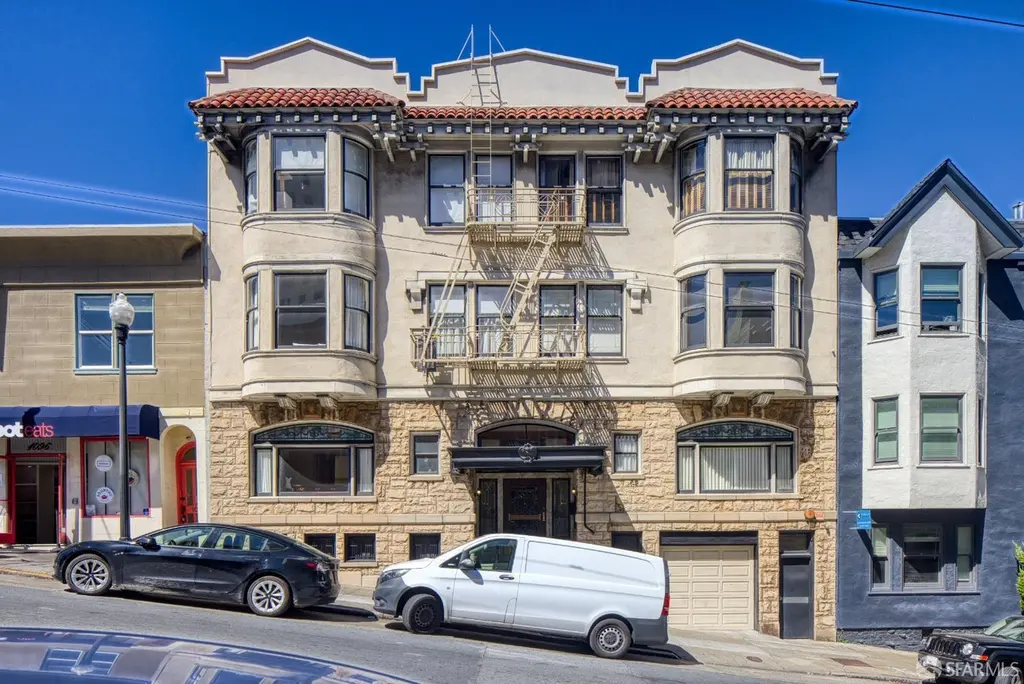
1082 Union St
San Francisco, CA 94133
$6,800,000B-
182 bd · None ba ·
14,215 sqft ·
Built 1914
· MultiFamily
· Pending
· 37 DOM
Cashflow @ list (25.0% down · 7.5%)
Estimated rent
$70,188/mo
Mortgage (P&I)
−$35,660
Tax + insurance
−$11,333
HOA
−$0
Vac / Maint / Mgmt
−$14,739
Net cashflow
$8,455/mo
Annual
$101,463/yr
Cap rate
7.79%
Cash-on-cash
5.33%
DSCR
1.24
1% rule
1.03%
Cash to close
$1,904,000
Investor read
- This is a 12×1bd/1ba + 1×2bd/2ba units multifamily listed at $6.80M. Condition is rated good.
- At list price, monthly cash flow is $8k ($101k/yr) — positive. Per door: $650/mo.
- The deal already cash-flows at list — no discount required.
- Meets the 1% rule at list price ($70k rent vs $6.80M).
- It's been on market 37 days — a 3% lower offer ($6.60M) is reasonable based on typical stale-listing flexibility.
- Recommended offer: $6.60M (3.0% below list) — sets the bar for market timing.
- In year one you build about $485k of equity ($47k loan paydown + $438k appreciation (6.4% local appreciation)).
- Location reads 76/100 on livability (#90 in CA, #3,143 nationally) — a middle-class / working-renter tenant base. Strengths: amenities A+, commute A+, employment A+; Watch: crime F, cost of living F.
- San Francisco Unified (urban): math 50% / reading 56% proficiency, ranked #322 of 1,400 in CA (top 23%) — acceptable for families but not a draw, mixed tenant base, ~2y average lease.
- Watch-outs: built in 1914 — expect roof / HVAC / electrical / plumbing capex.
- Market conditions: Rents rising fast (+16.9%/yr); 60 active listings in the ZIP; solid renter incomes; 750 units permitted in San Francisco County in 2024 (688 in 5+ unit buildings).
- San Francisco County population projected at +39% by 2050 — long-run rental-demand tailwind backs the buy-and-hold thesis.
- At projected returns (6.4% appreciation + 8.0% rent growth), your $1.90M cash investment doubles in ~3 years — after that, you're playing with house money.
- By year 2, paydown + projected appreciation supports a ~$776k cash-out refi (75% LTV) — recoverable capital for the next deal without selling this one.
- Cap rate 7.8% vs local median 2.1% in San Francisco — top-decile yield for the area; either an underpriced asset or a hidden risk that comps aren't pricing in. Stress-test before assuming the spread holds.
- At $70,188/mo this rent would consume 966% of the median local household income ($87k/yr) (locally 2027% of renters already pay >50% of income on rent) — very limited rent-growth headroom before tenants either downsize or default.
Questions for listing agent
- It's been on market 37 days. Have you received any prior offers? Is the seller open to a 3% concession, seller financing, or rate buy-down credit?
- Can we see the unit-by-unit rent roll, current vacancy, and any below-market leases? What's the average tenancy length?
- What capital expenditures (roof, boiler, parking lot, exteriors) have been made in the last 5 years, and what's planned in the next 2?
- Built in 1914 — when were the roof, HVAC, electrical panel, plumbing, and water heater last replaced?
- Is there a deadline driving the sale (1031 exchange, divorce, estate, relocation)? That informs how much negotiation room exists.
- Schools are B-rated — typically a magnet for longer-tenancy family renters. What's the average tenant stay here, and is there a school-zone premium baked into asking?
- Crime grade is F in this area — have there been break-ins, vandalism, or insurance claims at this property in the last 3 years? What carrier currently insures it and at what premium?
- What's the average days-on-market for RENTAL listings here right now (not sales)? A rising rental-DOM trend means longer vacancies and softer asking-rent achievability than the comps imply.
CashFlowRE · CFR-NHJSVF9PX7K827
· Data 3 weeks ago
cashflowre.app · 2026-05-29