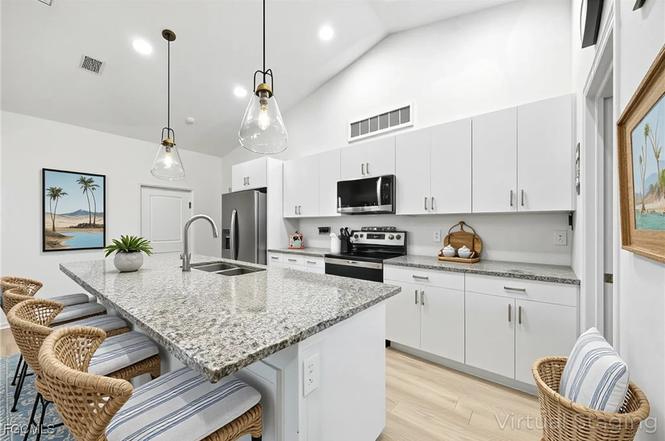
9048 Lamkin Cir
Port LaBelle, FL 33935
$249,900C-
3 bd · 2.0 ba ·
1,408 sqft ·
Built 2020
· SingleFamily
· Pending
· 107 DOM
Cashflow @ list (25.0% down · 7.5%)
Estimated rent
$2,218/mo
Mortgage (P&I)
−$1,311
Tax + insurance
−$530
HOA
−$0
Vac / Maint / Mgmt
−$466
Net cashflow
$-88/mo
Annual
$-1,060/yr
Cap rate
5.87%
Cash-on-cash
-1.52%
DSCR
0.93
1% rule
0.89%
Cash to close
$69,972
Investor read
- This is a 3-bed/2.0-bath single-family listed at $250k.
- At list price, monthly cash flow is $-88 ($-1k/yr) — negative.
- To cash-flow at today's rent, offer at most $234k (6.2% below list).
- To meet the 1% rule (rent ≥ 1% of price), the offer needs to be $222k (11.2% below list).
- It's been on market 107 days — a 9% lower offer ($227k) is reasonable based on typical stale-listing flexibility.
- Recommended offer: $222k (11.2% below list) — sets the bar for 1% rule.
- In year one you build about $27k of equity ($2k loan paydown + $25k appreciation (10.0% local appreciation)).
- Location reads 62/100 on livability (#750 in FL) — a middle-class / working-renter tenant base. Strengths: cost of living A+, housing A+; Watch: schools F, amenities F, commute F.
- Hendry (town): math 35% / reading 40% proficiency, ranked #65 of 73 in FL (top 89%) — families likely to look elsewhere, expect single-tenant / working-renter base with shorter leases; 75% free/reduced lunch — lower-income household profile, screen leases tightly.
- Market conditions: 942 active listings in the ZIP; 19 comparable units currently listed for rent nearby; rentals at typical pace (median 17d on market — plan ~3-4 weeks tenant-placement turnaround); 557 units permitted in Hendry County in 2024 (45 in 5+ unit buildings).
- Hendry County population projected to shrink 7% by 2050 — rents likely to lag national; underwrite the cash flow, not the appreciation.
- 5 sale attempts since 3y ago; this cycle's ask has dropped $70k (22%) from the opening price — seller is motivated, your offer sets the floor, not the list.
- By year 2, paydown + projected appreciation supports a ~$43k cash-out refi (75% LTV) — recoverable capital for the next deal without selling this one.
- Climate carrying-cost: severe wind risk, 99% chance of damaging wind over 30y; extreme-heat days projected 7→27/yr by 2055 (HVAC capex compounding) — expect insurance premiums to compound above CPI over the hold.
- At $2,218/mo this rent would consume 47% of the median local household income ($57k/yr) (locally 498% of renters already pay >50% of income on rent) — very limited rent-growth headroom before tenants either downsize or default.
Questions for listing agent
- What do current leases actually rent for vs. the listed asking? Can we see a recent rent roll and the last 12 months of T-12 income?
- It's been on market 107 days. Have you received any prior offers? Is the seller open to a 11% concession, seller financing, or rate buy-down credit?
- Why hasn't it sold? Are there any deal-killer items the seller is aware of (foundation, flood, title, zoning, code violations)?
- Is there a deadline driving the sale (1031 exchange, divorce, estate, relocation)? That informs how much negotiation room exists.
- Schools are F-rated, which usually means shorter tenancies and higher turnover. Who's the typical renter profile here, and what's been the actual vacancy rate?
- What's the average days-on-market for RENTAL listings here right now (not sales)? A rising rental-DOM trend means longer vacancies and softer asking-rent achievability than the comps imply.
- What's the recent tenant-quality profile in this submarket — average credit score on applications, eviction rate, late-payment / NSF rate, and stable-employment percentage? A property-management company in the area should have these aggregated.
- How much new for-sale + rental construction is in the pipeline within 1–3 miles? Heavy new supply typically softens prices + rents 12–24 months out; constrained supply supports both.
CashFlowRE · CFR-NJDQDH00E97DT7
· Data 3 weeks ago
cashflowre.app · 2026-05-29